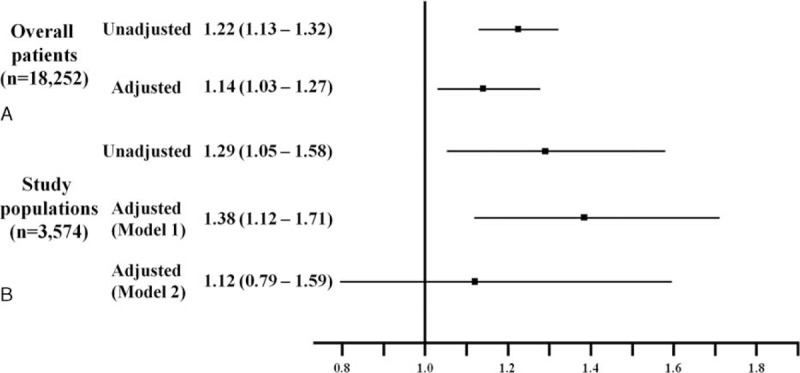
FIGURE 3.

Estimates of adjusted and unadjusted hazard ratios. (A) Overall patients, (B) study populations; (model 1), adjusted for age, sex, BMI, Killip class; presence or absence of hypertension, DM, dyslipidemia, follow-up lipid profile, previous CAD, smoking, (model 2), added follow-up hsCRP and NT-proBNP levels. BMI = body mass index, CAD = coronary artery disease, DM = diabetes mellitus, hsCRP = high sensitivity C-reactive protein, NT-proBNP = N-terminal prohormone of brain natriuretic peptide.
