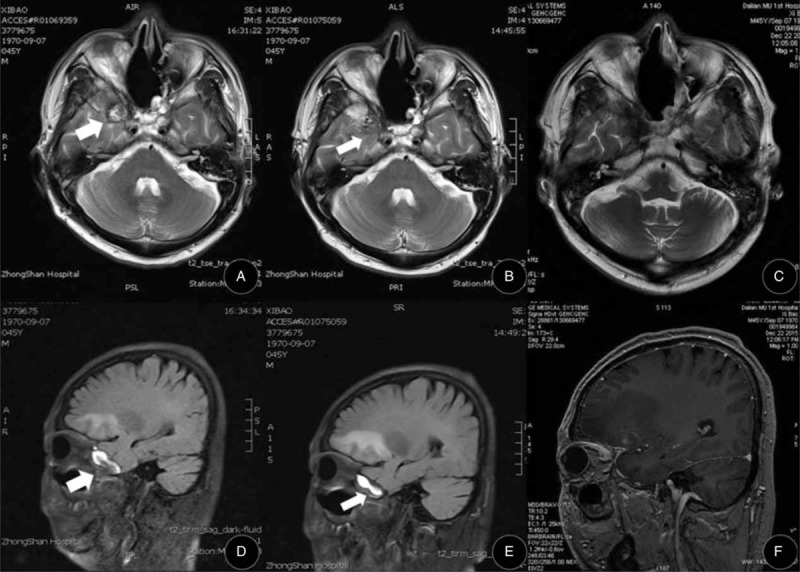
FIGURE 4.

(A and D) Enhancement cerebral magnetic resonance imaging (MRI) showing the right temporal lobe space-occupying lesion (white arrows): (A) Horizontal T2 imaging; (D) Sagittal T2 imaging (size: 15.8 × 13.6 × 14.3 mm). (B and E) Five days after the cetuximab and sunitinib treatment, enhancement cerebral MRI shows the right temporal lobe space-occupying lesion (white arrows) is reduced in size with blurred boundary to peripheral tissue: (B) Horizontal T2 imaging; (E) Sagittal T2 imaging (size: 12.6 × 9.1 × 9.3 mm). (C and F) One month after treatment, cerebral MRI shows that the right temporal lobe space-occupying lesion has completely disappeared: (C) Horizontal FSE imaging; (F) Sagittal M3D/BRAVO imaging.
