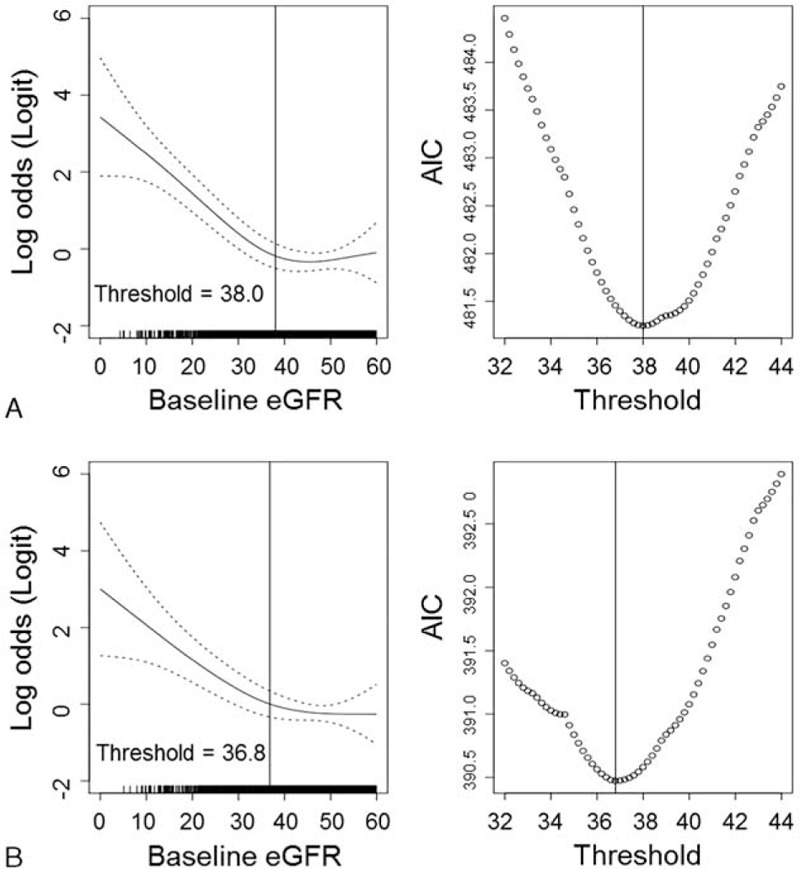
FIGURE 2.

GAMs using binomial distribution for analysis of the threshold baseline kidney function for increased risk of CT-CIN. In the univariate model (A), the smoothing function showing the association between eGFR and the log odds of CIN risk is displayed. In the multivariate GAM analysis (B), the association was adjusted for the following variables: age, sex, BMI, history of diabetes mellitus, history of hypertension, use of statins, ACE inhibitors or ARBs, and serum albumin level. The dotted line indicates the 95% confidence intervals of the logistic odds ratio of CIN risk. The right graphs show the calculated AIC of each GAM plot according to the baseline eGFR. ACE = angiotensin converting enzyme, ARB = angiotensin receptor blocker, BMI = body mass index, CI = confidence interval, CT-CIN = contrast-induced nephropathy, eGFR = estimated glomerular filtration rate, GAMS = generalized additive models.
