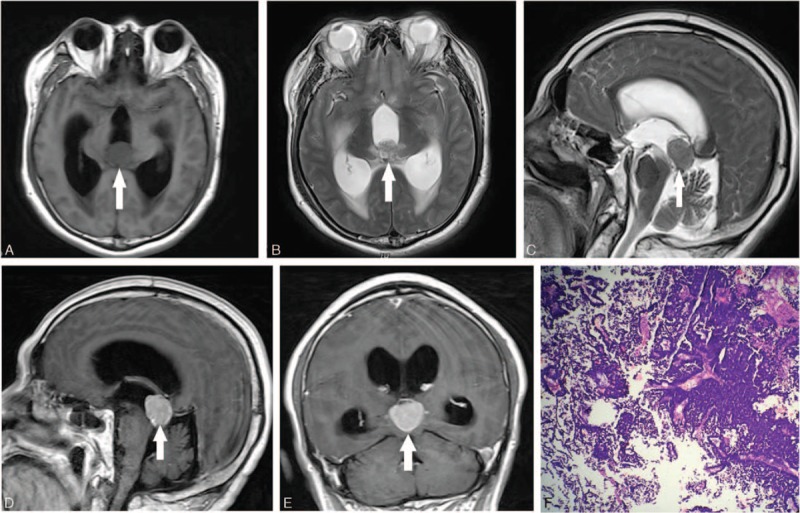
FIGURE 1.

T1-weighted axial (A), T2-weighted axial (B), and T2-weighted sagittal (C) images showing the pineal region tumor (arrow). Contrast-enhanced T1-weighted images (D, E) showing the tumor (arrow) with significant enhancement. Pathological image (F) showing metastatic urothelial carcinoma with tumor cells arranged in nests.
