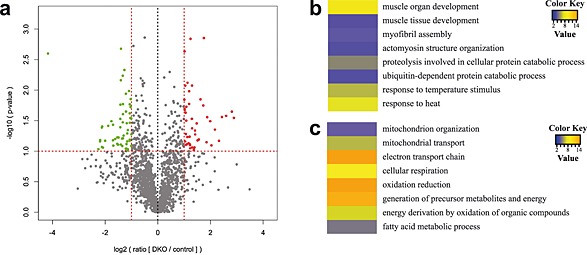
Figure 8.

Proteomic analysis of lysates from double knockout (DKO) compared with control soleus muscle. (A) Volcano‐plot. For each of the data sets, a t‐test was used to calculate the − log10 (P‐value), which was plotted vs. the log‐transformed means of the DKO/control ratios. Vertical lines indicate the top or bottom 30% most regulated proteins, while the horizontal line indicates the cut‐off for the significance of the P‐value. Proteins increased and decreased in DKO muscle are shown in red and green, respectively. (B) and (C) Heat‐map of the Z‐transformed P‐values obtained by Gene Ontology (GO)‐analysis of proteins upregulated in DKO muscle. The 30% upregulated (B) and 30% downregulated (C) proteins in DKO soleus were used for the GO analysis with the DAVID online tool 3. The obtained P‐values of GO‐term biological process that were significantly enriched (P < 0.05) were log‐transformed, Z‐transformed, hierarchically clustered, and plotted as a heat map. Colour key indicates P‐values.
