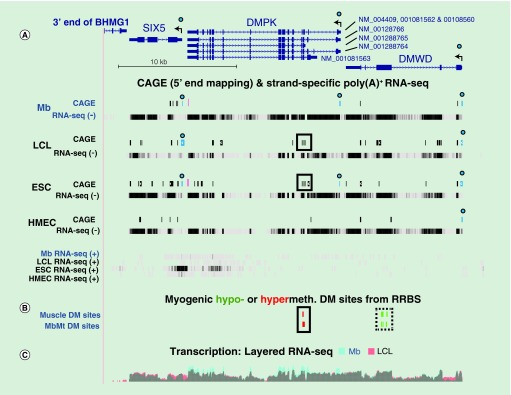
Figure 6. . Sense and antisense transcription and CAGE profiling in the DMPK, SIX5 and DMWD gene regions.
(A) CAGE and minus-strand RNA-seq profiles (-) for DMPK, SIX5 and DMWD with the plus-strand RNA-seq profiles (+) shown below (chr19:46,265,940–46,298,675; ˜33 kb). Circles over blue bars in CAGE tracks, 5′ ends corresponding to the canonical RefSeq isoforms; high red bars in CAGE tracks, signal that was stronger for plus-strand than for minus-strand transcripts; boxes around black bars, region of alternative promoter for DMPK. The vertical viewing for strand-specific RNA-seq was 0–30. (B) Muscle and MbMt hypomethylated and hypomethylated sites from RRBS datasets. (C) Overlaid nonstrand-specific RNA-seq profiles for just Mb and LCL samples indicate higher steady-state levels of DMPK in Mb.
CAGE: Cap analysis gene expression; DM: Differentially methylated; ESC: Embryonic stem cell; LCL: Lymphoblastoid cell line; RRBS: Reduced representation bisulfite sequencing.

