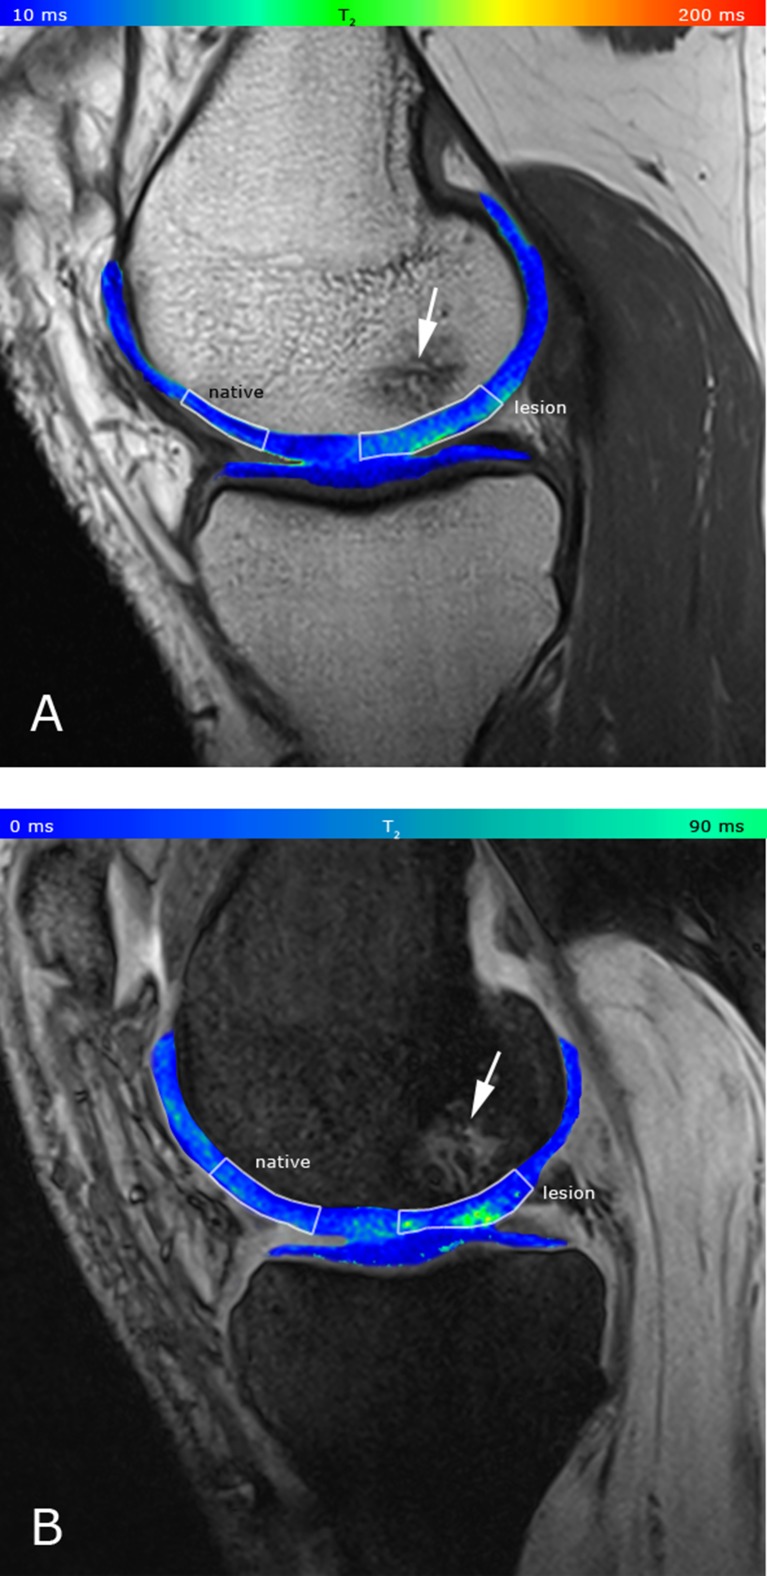
Fig. 5.
A: T2 map acquired by CPMG, pseudo-colour-coded and overlaid on a morphological image of a 41-year-old patient with Pridie drilling on the medial femoral condyle (TE = 11.9 ms); the ratio of native and lesion cartilage T2s is 0.81. B: T2 map acquired by 3D-TESS, pseudo-colour-coded and overlaid on the second acquired MR image (F0); the ratio of native and lesion cartilage T2s is 0.83. Focal increase in T2 values is observable with both techniques (’lesion’). Bone oedema is also present (large arrow). The dynamic range of the CMPG T2 map is higher compared to the 3D-TESS T2 map, therefore, the lesion appears to be more diffuse, although the ratios of native and lesion cartilage T2s are comparable between CPMG and 3D-TESS

