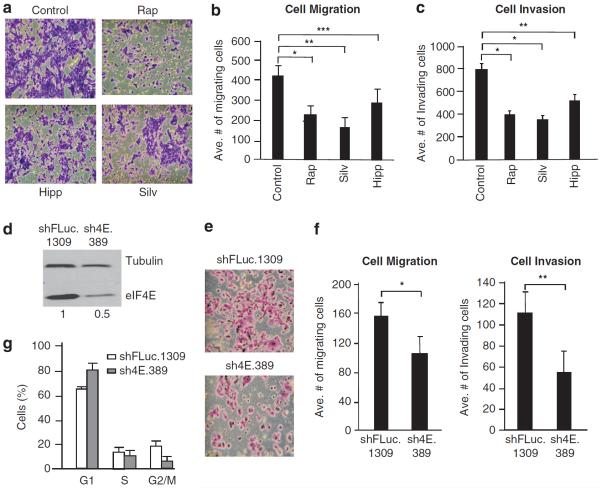
Figure 3.
Suppressing eIF4F activity decreases invasion and migration of TM15 cells. (a) Representative crystal violet staining of migrating and invading TM15 cells exposed to 20 nm RAP, 40 nm silvestrol or 40 nm hippuristanol. (b) Quantitation of TM15 cell migration. Data representing three different experiments with five fields counted per experiment. Bars represent s.e.m. *P<0.01; **P<0.001; ***P<0.05. (c) Quantitation of TM15 cell invasion. Data representing three different experiments with five fields counted per experiment. Bars represent s.e.m. *P<0.001; **P<0.01. (d) Immunoblot analysis of DOX-treated sh4E.389- and shFLuc.1309-infected TM15 cells. The relative quantitation of the relative eIF4E levels is provided below the blot and is from three independent experiments. (e) Representative crystal violet staining of migrating and invading DOX-treated sh4E.389- or shFLuc.1309-infected TM15 cells. (f) Quantitation of cell migration (left panel) and Matrigel invasion (right panel) of DOX-treated sh4E.389- and shFLuc.1309-infected TM15 cells. Data represent three independent experiments with five fields counted per experiment. Bars signify s.e.m. * P = 0.08; **P<0.005. (g) Cell cycle analysis of shFLuc.1309- and sh4E.389-infected TM15 cells; n = 3; Bars represent s.e.m.

