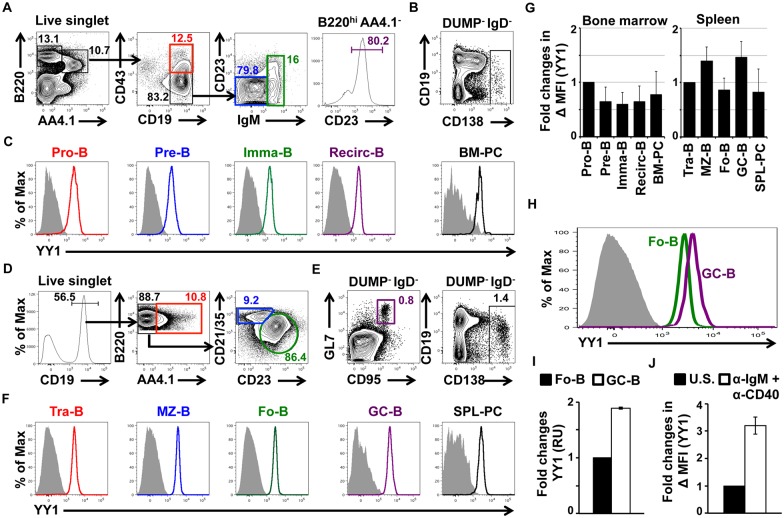
Fig 1. YY1 expression at various B cell developmental stages.
(A) Bone marrow cells from non-immunized control Cγ1Cre mice were stained with various antibodies to identify B cell developmental subsets, and (B) plasma cells. A. After doublet and dead cell discrimination, progenitor B cells (Pro-B) were phenotyped as B220+AA4.1+CD19+CD43+ cells; precursor B cells (Pre-B) were phenotyped as B220+AA4.1+CD19+CD43-CD23-IgM- cells; immature B cells (Imma-B) were phenotyped as B220+AA4.1+CD19+CD43-CD23+/-IgM+ cells and recirculating mature B cells (Recirc-B) were phenotyped as B220+AA4.1--CD23+ cells. B. We used CD138 to detect bone marrow plasma cells (BM-PC). We gated on CD4−CD8−F4/80−Gr1−(DUMP gate)IgD- cells that were CD138+. (C) Bone marrow B cell subsets and plasma cells (gated as shown in A & B) were stained with anti-YY1 antibody or corresponding isotype control. (D) Spleen cells from Cγ1Cre mice were stained with various antibodies to identify B cell subsets (it should be noted that our follicular B cell gating may contain a very small percentage of B1 cells), (E) germinal center B cells (GC-B) and plasma cells (SPL-PC). D. After doublet and dead cell discrimination, transitional B cells (Tra-B) were phenotyped as CD19+AA4.1+ cells; marginal zone B cells (MZ-B) were phenotyped as CD19+AA4.1-CD21/35hiCD23lo cells and follicular B cells (Fo-B) were phenotyped as CD19+AA4.1-CD21/35loCD23hi cells. E. GL7 and CD95 were used to detect GC-B cells, and CD138 to detect SPL-PC. We gated on DUMP-IgD- cells that were further subdivided into GL7hiCD95hi GC-B and CD138+ SPL-PC. (F) Spleen B cell subsets, GC-B cells and SPL-PC (gated as shown in D & E) were stained with anti-YY1 antibody or corresponding isotype control. (G) Fold changes in mean fluorescence intensity (MFI) of YY1 in bone marrow B cell subsets (left panel, fold changes compared to pro-B cells) and spleen B cell subset (right panel, fold changes compared to tra-B cells). Fig A-G are representative results are from three independent experiments (n = 3 mice). (H) Comparison of YY1 staining of follicular and germinal center B cells. (I) Fo-B and GC-B cells were FACS sorted and YY1 expression was measured by qPCR. Expression was normalized to FO B cells (n > 3 mice). (J) Fold change in MFI of YY1 in un-stimulated (U.S.) or α-IgM + α-CD40 stimulated Fo-B cells after 3 days. Fig A-H are representative results from at least three independent experiments (n = 3 mice).

