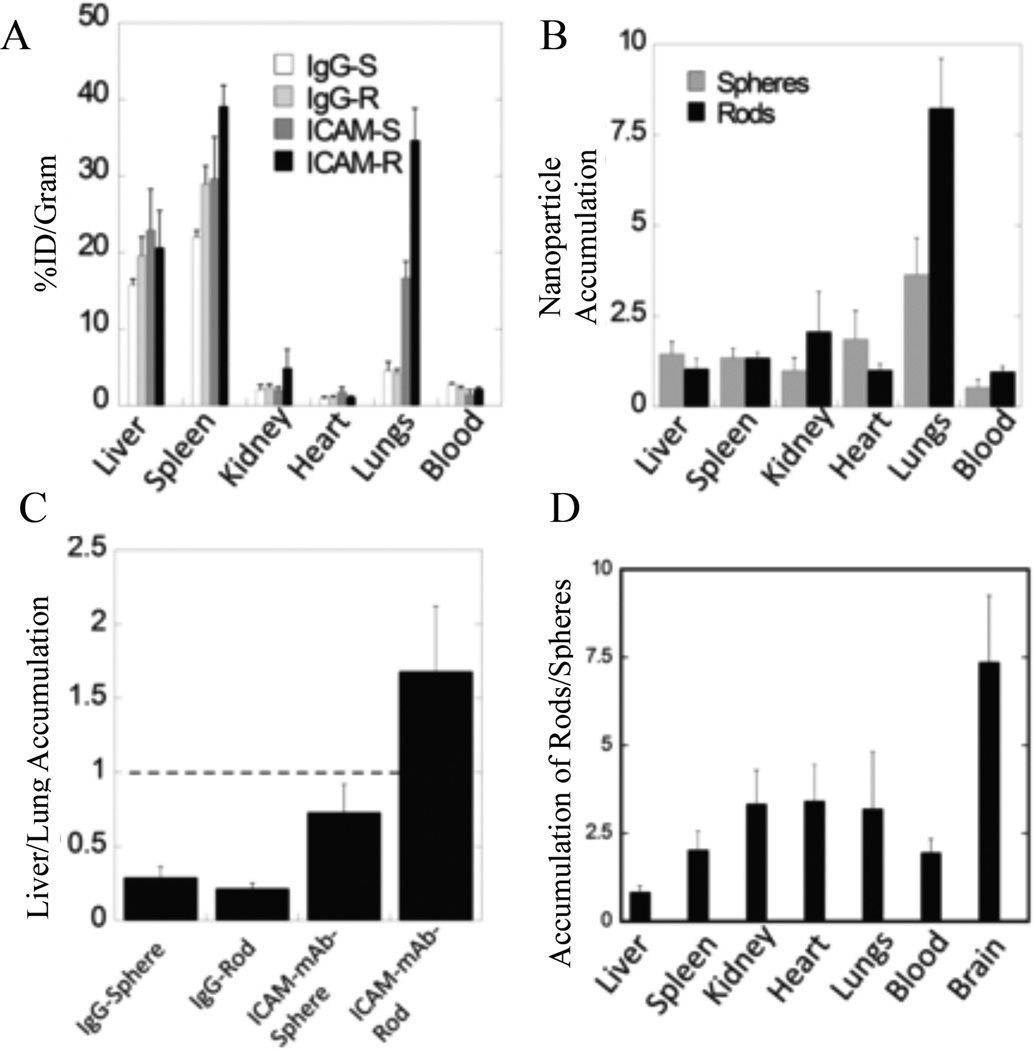
Figure 7.
Biodistribution of ICAM-1 targeted particles. (A) Distribution of PS ICAM-targeted or IgG-coated spheres and rods and (B) the same data as a ratio of non-specific IgG particle accumulation to specific ICAM-targeted particle accumulation for spheres and rods. (C) Representation of the same data as a ratio of lung to liver accumulation and the resulting (D) ratio of rods to spheres found in each organ.86 Reproduced with permission from reference #86. Copyright 2013 National Academy of Sciences, U.S.A.

