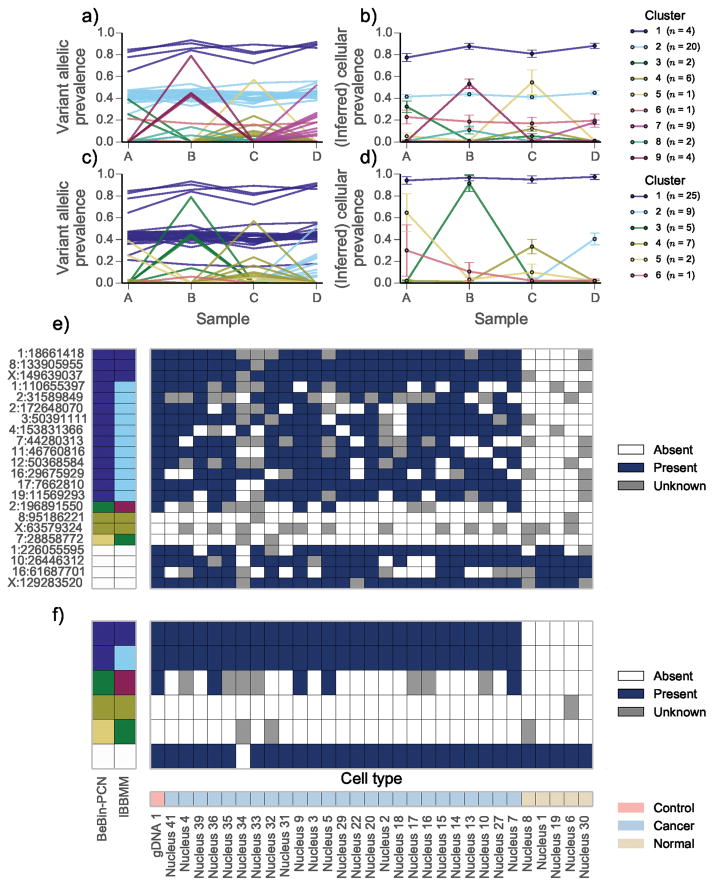
Figure 2.
Joint analysis of multiple samples from high grade serous ovarian cancer (HGSOC) 2 | The variant allelic prevalence for each mutation color coded by predicted cluster using the (a) IBBMM and (c) PyClone with BeBin-PCN model to jointly analyse the four samples. The inferred cellular prevalence for each cluster using the (b) IBBMM and (d) BeBin-PCN methods. As in Fig. 1 the cellular prevalence of the cluster is the mean value of the cellular prevalence of mutations in the cluster. (e) Presence or absence of variant allele at target loci in single cells from sample B. Loci with less than 40 reads covering them are coloured gray. Predicted clusters for each method are show on the left, with white cells indicating non-somatic control positions. (f) Presence or absence of IBBMM clusters in single cells from sample B. Clusters were deemed present if any mutation in the cluster was present. (b, d) Error bars indicate the mean standard deviation of MCMC cellular prevalences estimates for mutations in a cluster. The number of mutations n in each cluster is shown in the legend in parentheses.

