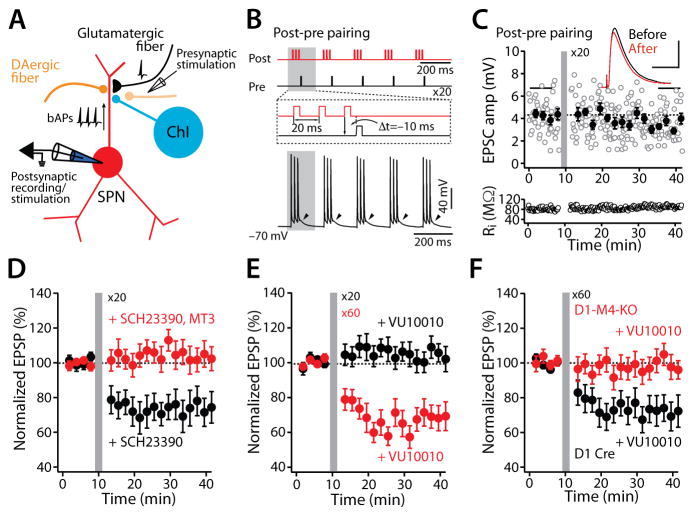
Figure 1. M4R signaling promotes induction of LTD at dSPN glutamatergic synapses.
(A) The experimental configuration. (B) The post-pre theta-burst pairing protocol for induction of LTD. (C) LTD was not induced by a post-pre timing pairing in dSPNs. Plots show EPSP amplitude (amp) and membrane input resistance (Ri) as a function of time. The dashed line represents the average EPSP amplitude before induction. STDP pairing is indicated by the vertical bar. Filled symbols specify the averages of 12 trials (± SEM). The averaged EPSP traces before and after induction are shown at the top. Scale bars, 2 mV x 80 ms. (D) In the presence of D1R antagonist SCH23390 (3 μM), a post-pre timing pairing revealed LTD; the LTD was disrupted by addition of the selective M4R antagonist MT3 (100 nM). Data are represented as mean ± SEM. Plot of the average EPSP amplitudes as a function of time. (E) With 20 repetitions of the pairing protocol, bath perfusion of VU10010 did not lead to LTD induction. However, when the number of repetitions was increased to 60 in the presence of the M4R PAM, LTD induction was robust. Plot of the average EPSP amplitudes as a function of time. Error bars represent ± SEM. (F) In D1-Cre mice, post-pre pairing led to LTD when VU10010 (5 μM) was bath applied; but the same protocol had no effect on the induction of LTD in D1-M4-KO mice. Data are shown as mean ± SEM. Plot of the average EPSP amplitudes as a function of time (see also Figures S1 and S2).

