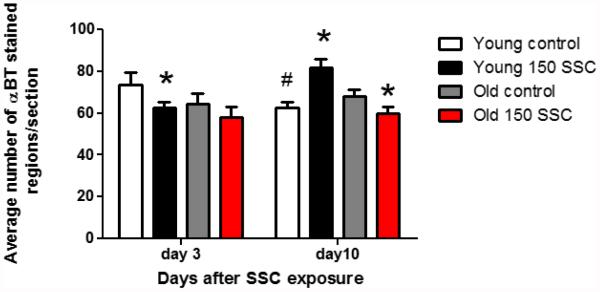
Figure 3.
This graph shows the average number of αBT-stained regions ( ± SEM) per section. On day three, there is a reduction in αBT staining in the young rats exposed to iSSCs. However, 10 days after injury, control rats displayed a reduction in αBT staining as compared to day 3 control rats (# p <0.05). In the LTA of young rats αBT staining was increased, but decreased in the LTA of old rats (*p <0.05, different than control rats).

