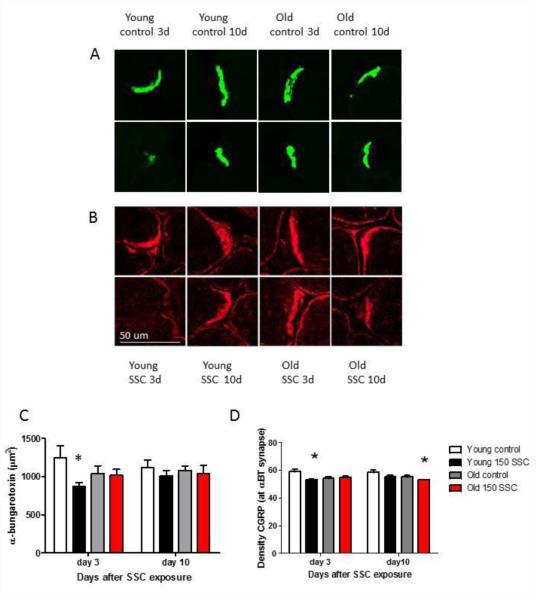
Figure 4.
Photomicrographs showing αBT staining (A) and CGRP staining (B) at the neuromuscular juction. The top row of each panel are photomicrographs from control rats and the bottom panels are photos from iSSC exposed rats. The area stained with αBT in samples of the NMJ are presented in C. Young rats showed a reduction in the area stained with αBT 3 days following iSSC exposure (*p < 0.05, less than age-matched controls). There were no other significant changes in αBT staining. The density of CGRP staining that was co-localized with αBT and the NMJ is presented in Figure D. CGRP staining was reduced at the NMJ of youg rats 3 days following iSSC exposure. By 10 days CGRP was back to control levels at the NMJ of young rats. However in old rats exposed to iSSCs, CGRP at the synpase was reduced (*p < 0.05, less than age-matched controls, Bar in Figure B is 50 µm).

