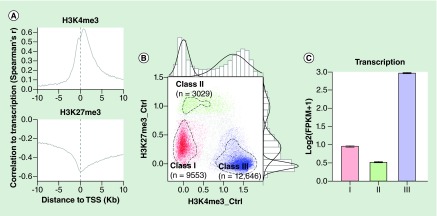
Figure 1. . The correlation between H3K4me3 and H3K27me3 around transcription start sites and transcription level of the genes associated with the transcription start sites.
(A) The correlation coefficients were computed with nonparametric Spearman's method. The strength of the correlation was tracked along the relative location toward the transcription start sites (TSSs). Levels of H3K4me3 were positively associated with transcript abundance and levels of H3K27me3 were negatively associated with transcript abundance. (B) Classification of TSSs based on their H3K4me3 and H3K27me3. Average H3K4me3 and H3K27me3 between -250bp and +250bp of each TSS were computed and plotted after adjusting to background signals and log10-transformation. The bimodal and trimodal distributions of H3K4me3 and H3K27me3 were also plotted along the sides of the scatterplot. The circled dashed lines represent the borders of clustered TSSs. TSSs of these three clusters were used as seeds of an SVM model to classify other TSSs (Supplementary methods) and extra TSSs of each class were identified by the model. TSSs labeled in gray were ones that could not be definitively classified into any class, which accounted for about 8% of the total TSSs. (C) The barplot shows the average transcription level of genes associated with each class. Genes associated with class III TSSs had higher transcription level while class II TSSs were associated with transcription level lower than global average (the dashed line).
TSS: Transcription start site.

