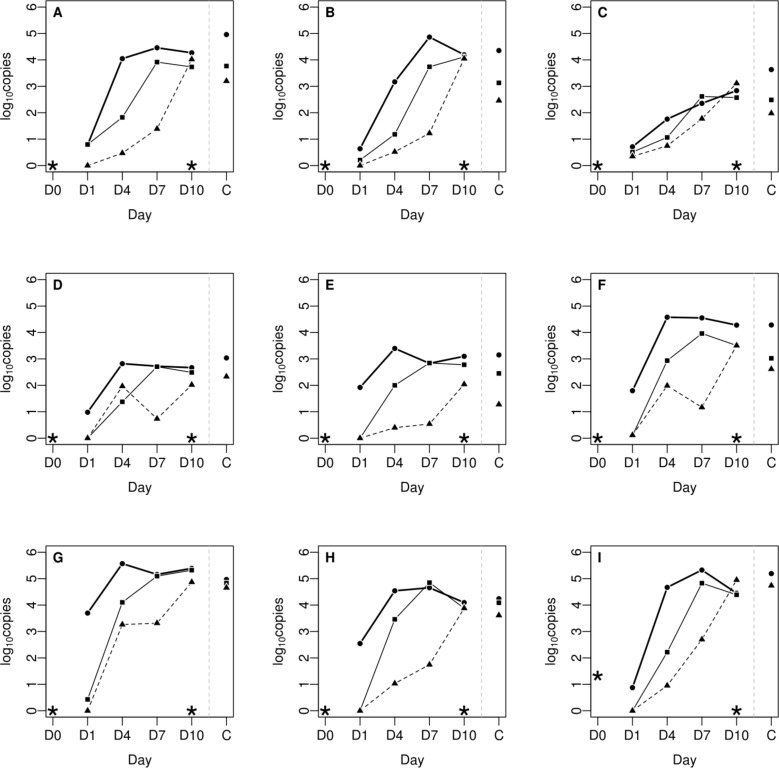
Fig 2. Chlamydial load in 1 g of tissue from individual organs during the course of the 10-day infection experiment (filled circles: non-diluted inoculum; squares: 10−2 dilution; triangles: 10−4 dilution).
A: spleen; B: liver; C: lung; D: duodenum; E: jejunum; F: ileum; G: cecum; H: rectum; I: cloacal swab. (C) Contact birds on 10 dpi. (*) Control group.

