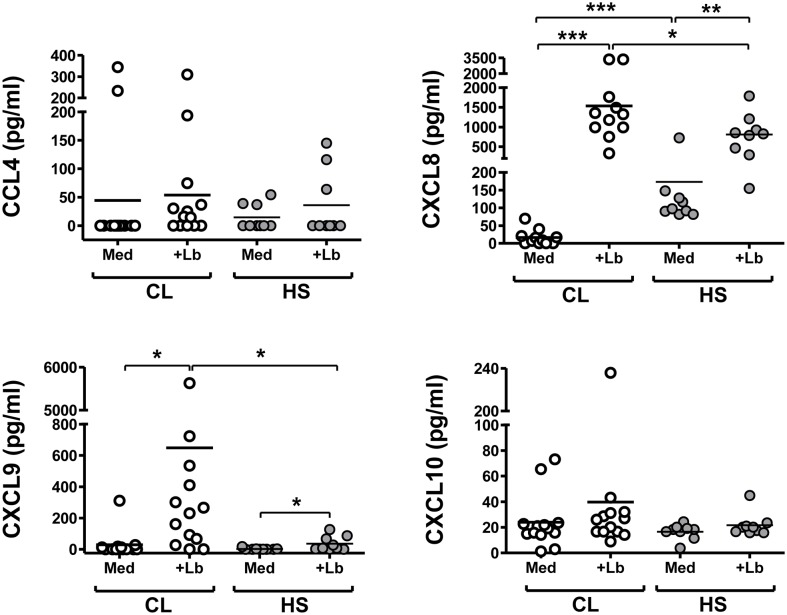
Fig 4. Chemokines produced by neutrophils from CL patients or healthy controls.
Neutrophils from CL patients (n = 13) or healthy controls (n = 9) were incubated with L. braziliensis at a 5:1 ratio for 180 minutes. The concentrations of the indicated chemokines in the supernatants were evaluated by ELISA. Each symbol represents mean values from a different patient, and lines represent the median of each group. The Mann-Whitney test was used to compare differences between CL versus Healthy Control groups (*p<0.05, ***p<0.001).

