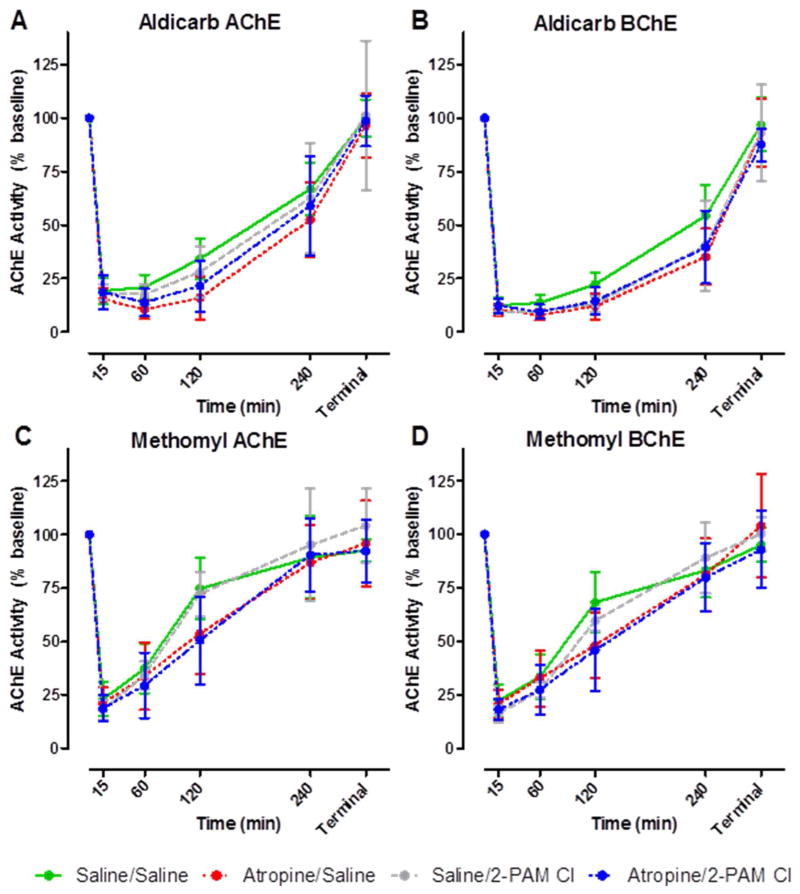
Figure 3. Serial blood samples were taken and AChE and BChE activity was determined following challenge with aldicarb (A and B) or methomyl (C and D). Within 15mins following challenge, ChE activity was reduced by ~75% but returned to pre-challenged levels within 24hrs regardless of treatment.
ChE analysis was performed using an Ellman’s based assay. Animals were challenged with varying concentrations of aldicarb or methomyl and blood was collected at specific time points post challenge: 0, 0.25, 4, 2, 4, 24h. Each time point is the mean ± SEM of all samples collected for that treatment and CM group (n ≥ 6) including varying CM concentrations. Due to the varying challenge doses with each treatment group, this data only reflects trends in ChE activity and no statistical analysis was able to be conducted.

