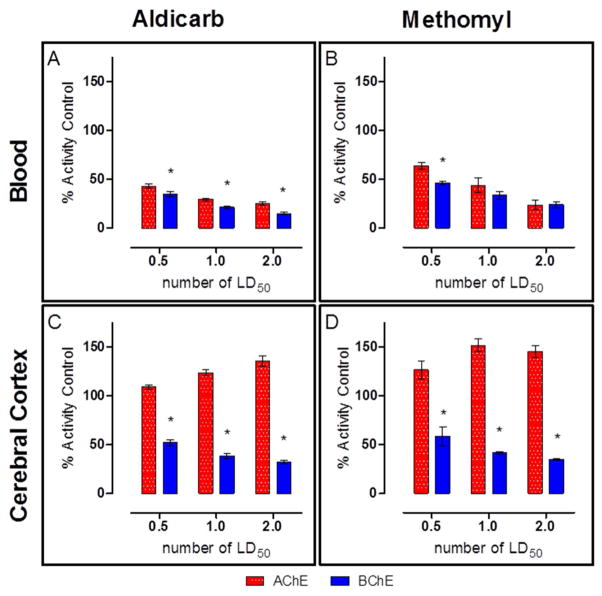
Figure 6. Blood and Cerebral cortex ChE activity 30min post exposure to Aldicarb (A and C) or Methomyl (B and D). Blood AChE and BChE activities were similar but a statistically significant difference was observed between AChE and BChE activity. Additionally, the cerebral cortex also had a statistically significant difference between AChE and BChE activities but the difference was greater than in the blood.
Cerebral cortex was perfused prior to removal. Animals were challenged with multiples of the previously determined MLD: 0.5, 1 or 2. Data shown are mean ± SEM, representing n = 5, (*) p<0.05.

