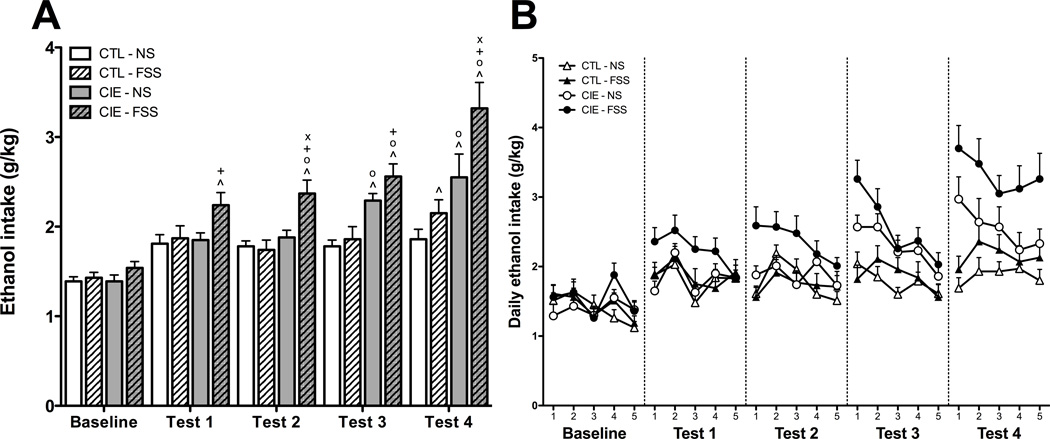
Fig. 2.
(A) Average weekly ethanol consumption. Increases relative to baseline ethanol consumption (indicated by ^) were observed during Test 4 for CTL-FSS mice (hatched white bars), Tests 3–4 for CIE-NS mice (gray bars), and Tests 1–4 for CIE-FSS mice (hatched gray bars). Elevated ethanol consumption relative to CTL-NS mice (white bars) was observed during Tests 3–4 for CIE-NS mice and Tests 2–4 for CIE-FSS mice (indicated by o). CIE-FSS also demonstrated greater ethanol intake than CTL-FSS mice during Tests 1–4 (indicated by +) and greater intake than CIE-NS mice during Tests 2 and 4 (indicated by x). Values shown are Means ± SEMs
(B) Average daily ethanol consumption. During Test 2, CIE-FSS mice (black circles) drank more than all other groups. During Test 3, both CIE-NS (white circles) and CIE-FSS groups consumed more ethanol than CTL-NS (white triangles) and CTL-FSS (black triangles) mice. CIE-FSS mice consumed more ethanol than all other groups during Test 4. Additionally, CIE-NS mice consumed more ethanol than mice in the CTL-NS condition. No interactions of Group and Day were observed during any week of testing. Values shown are Means ± SEMs

