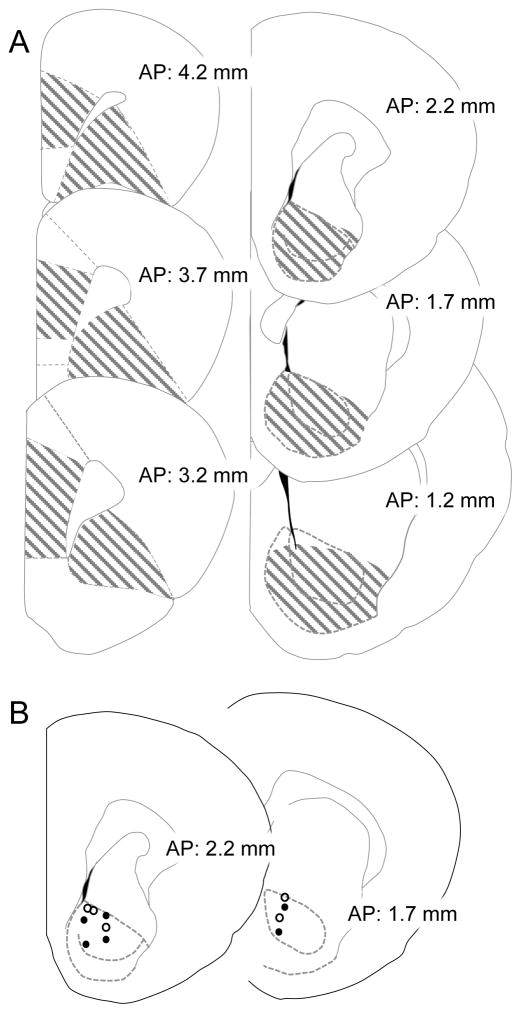
Figure 2.
A: Representative schematic depicting the location of tissue punches taken from the medial prefrontal cortex and orbitofrontal cortex (left) and ventral striatum (right) in Experiment 1. B: Location of carbon fiber electrode placements in the NAc for Experiment 2 estimated from the histological analysis, with open circles representing recordings from the BAL group and filled circles those from the Phe/Tyr[-] group.

