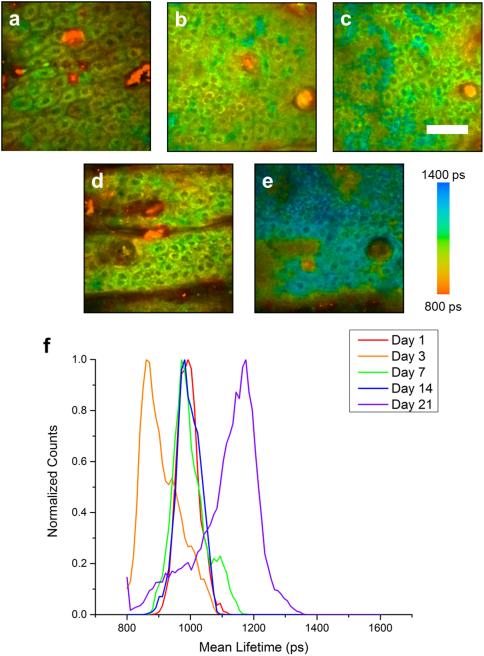
Figure 1. Longitudinal FLIM imaging of fluticasone propionate (FP) treated animals.
Lifetime imaging of keratinocytes in the epidermis at days 1 (a), 3 (b), 7 (c), 14 (d), and 21 (e) in an animal treated twice daily with FP. Normalized histograms of mean NADH lifetime of cell regions show a noticeable increase in mean lifetime at day 21 (f). Scale bar is 50 μm. ps – picoseconds.

