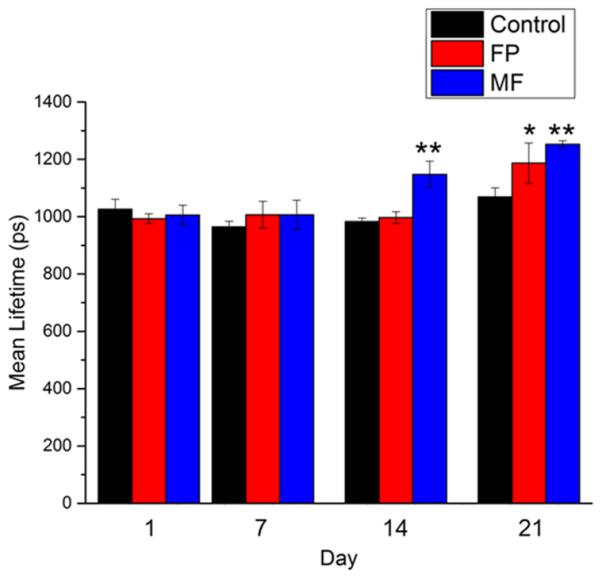
Figure 3. Statistical analysis of mean NADH lifetime measurements.

Statistical analysis performed on all animals and imaging locations shows a significant increase in mean lifetime for the FP group at day 21 and for the MF group at days 14 and 21 compared to the control group. Statistical testing performed using Student’s t-test * p < 0.05 ; ** p < 0.01.
