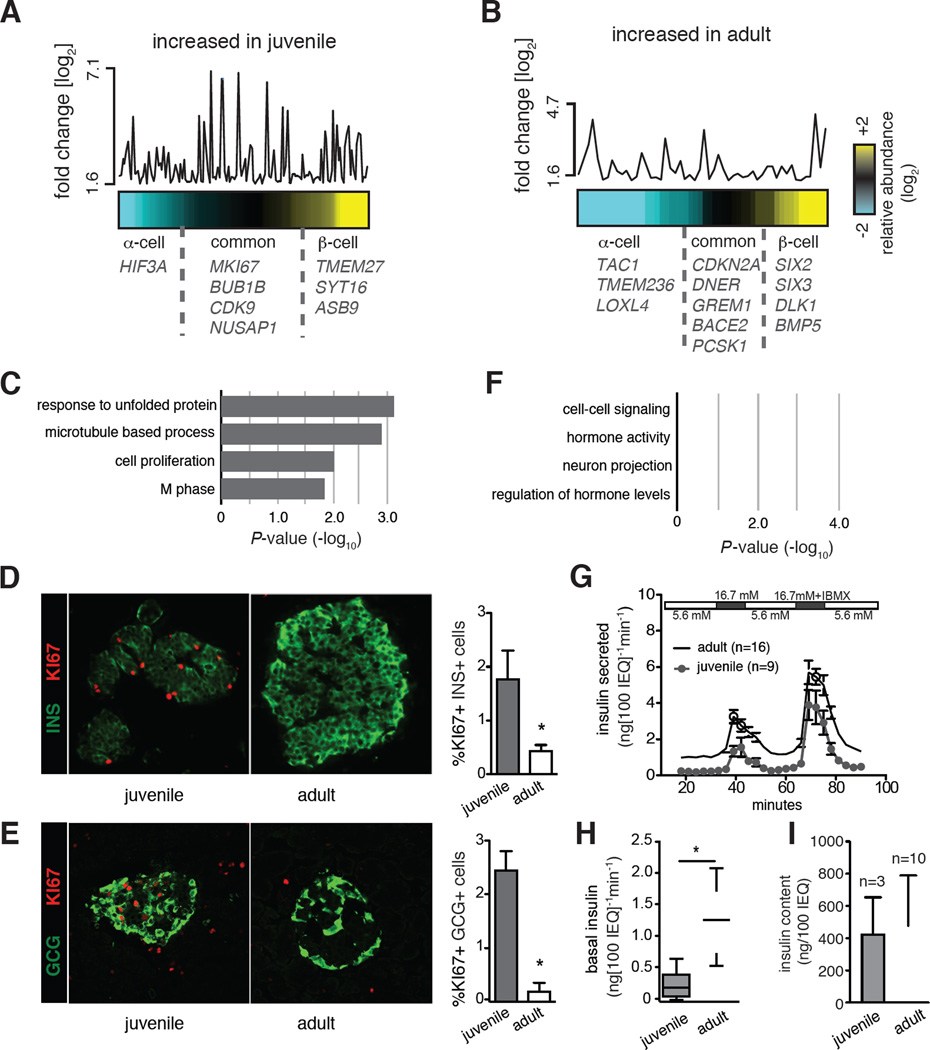
Figure 2. Age-dependent gene expression and functional changes in human islet cells.
Heat maps representing the relative abundance of age-dependent genes increased either in juvenile (A) or adult (B) samples. The y-axis shows the fold change of expression between different age groups. Each point corresponds to an age-dependent gene and its position is aligned with the column position in the heat map. Age-dependent genes more abundant in β-cells are colored yellow, in α-cells colored cyan, equal abundance is represented in black. Names of select genes are indicated on the plots. For the full list, see Table S2. (c) GO Term enrichment analysis of genes increased in juvenile (C) or adult (F) samples. Top scoring biological process terms are graphed. Immunostaining for KI67 and (D) Insulin (INS) or (E) Glucagon (GCG) in juvenile (2-year-old) and adult (31-year-old) pancreatic sections. Quantifications on the right (* t-test P < 0.05). Error bars indicate S.D. (G) Dynamic GSIS results of perifused human juvenile (n=9) and adult (n=16) islets, IEQ: islet equivalent. (H) Box plots show secreted insulin levels of juvenile (n=9) and adult (n=16) islets in the last fraction exposed to 5.6 mM glucose (basal) before a step increase to 16.7 mM glucose. (I) Insulin content of equivalent numbers of juvenile (n=3) and adult islets (n=10). Also see Experimental Procedures (* t-test P<0.05; Error bars indicate S.E.).

