

Abstract
Background and aims
Obesity is frequently associated with cirrhosis, and cirrhotic patients may develop simultaneous loss of skeletal muscle and gain of adipose tissue, culminating in the condition of sarcopenic obesity. Additionally, muscle depletion is characterized by both a reduction in muscle size and increased proportion of muscular fat, termed myosteatosis. In this study, we aimed to establish the frequency and clinical significance of sarcopenia, sarcopenic obesity and myosteatosis in cirrhotic patients.
Methods
We analysed 678 patients with cirrhosis. Sarcopenia, sarcopenic obesity and myosteatosis were analysed by CT scan using the third lumbar vertebrae skeletal muscle and attenuation indexes, using previously validated gender‐and body mass index‐specific cutoffs.
Results
Patients were predominately men (n = 457, 67%), and cirrhosis aetiology was hepatitis C virus in 269 patients (40%), alcohol in 153 (23%), non‐alcoholic steatohepatitis/cryptogenic in 96 (14%), autoimmune liver disease in 55 (8%), hepatitis B virus in 43 (6%), and others in 5 patients (1%). Sarcopenia was present in 292 (43%), 135 had sarcopenic obesity (20%) and 353 had myosteatosis (52%). Patients with sarcopenia (22 ± 3 vs. 95 ± 22 months, P < 0.001), sarcopenic obesity (22 ± 3 vs. 95 ± 22 months, P < 0.001), and myosteatosis (28 ± 5 vs. 95 ± 22 months, P < 0.001) had worse median survival than patients without muscular abnormalities. By multivariate Cox regression analysis, both sarcopenia [hazard ratio (HR) 2.00, 95% confidence interval (CI) 1.44–2.77, P < 0.001], and myosteatosis (HR 1.42, 95% CI 1.02–1.07, P = 0.04) were associated with mortality.
Conclusions
Sarcopenia, sarcopenic obesity and myosteatosis are often present in patients with cirrhosis, and sarcopenia and myosteatosis are independently associated with a higher long‐term mortality in cirrhosis.
Keywords: Lumbar skeletal muscle index, Muscle attenuation index, Overweight, Muscle depletion, Myosteatosis, Cirrhosis
Introduction
Overweight and obesity are endemic in Western countries comprising up to 35% of the total population.1, 2 Overweight and obesity have been associated with development of chronic liver disease, worsening of liver fibrosis and progression to cirrhosis,3, 4 and the body mass index (BMI) has been considered an independent risk factor for the development of decompensation among cirrhotic patients of all causes.5
Severe muscle depletion or sarcopenia is one of the most common complications in cirrhosis,6, 7, 8, 9, 10 and despite its important role in the prognosis of cirrhosis, it is frequently overlooked as body composition assessments can be challenging in cirrhotic patients with fluid retention or who are overweight or frankly obese.11, 12
Muscularity assessment with cross‐sectional imaging studies has become an attractive index of nutritional status evaluation in cirrhosis,13, 14 and different methods have been used for the estimation of the muscle mass from axial CT scans, such as the psoas muscle area, or the thickness of the psoas muscle at different levels of lumbar spine (L3, L4) or at the level of umbilicus,15, 16, 17 and the cross‐sectional area of muscle normalized for stature referred to as the L3 skeletal muscle index (L3 SMI).18
The CT analysis is not biased by the fluid overload that frequently presents in decompensated cirrhosis, and sarcopenia reflects a chronic detriment in general physical condition, rather than acute severity of the liver disease.19 Sarcopenia in cirrhosis is part of the frailty complex present in these patients, characterized by a decreased reserve and resistance to stressors and predisposition to poor outcomes.20, 21, 22, 23
Patients with cirrhosis may develop simultaneous loss of skeletal muscle and gain of adipose tissue, culminating in the condition of ‘sarcopenic obesity’.24, 25 In addition, muscle depletion is characterized by both a reduction in muscle size and increased proportion of intermuscular and intramuscular fat denominated ‘myosteatosis’. Myosteatosis increases with age and adiposity26 and is associated with metabolic abnormalities,27 decreased strength and mobility.28
In this study, our goals were to establish the frequency and factors associated with sarcopenia, sarcopenic obesity and myosteatosis in a cohort of cirrhotic patients evaluated for liver transplantation. In this fashion, we aimed to establish the impact of these muscular abnormalities on the prognosis of cirrhotic patients.
Materials and methods
Study population
Six hundred and seventy‐eight adult patients with cirrhosis who were evaluated for liver transplantation between January 2000 and May 2013 at the University of Alberta Hospital (Edmonton, AB, Canada) and had an abdominal CT scan including the third lumbar (L3) vertebrae as part of their pre‐transplant evaluation were evaluated.
Clinical and laboratory assessments
Data recovered from medical charts included gender, age, weight, height, cirrhosis aetiology and liver biochemistries, serum albumin, serum creatinine, international normalized ratio (INR), Child–Pugh and model for end stage liver disease (MELD) scores. Clinical, laboratory and radiological data used for the analysis, and to calculate MELD and Child–Pugh scores were obtained within 1 week from the CT used to quantify muscle indices (time zero).
Sarcopenia, sarcopenic obesity and myosteatosis evaluation
The CT scans used for analysis were carried out as part of the liver transplant assessment. A transverse CT image from L3 was assessed from each scan. Images were analysed with SliceOmatic V4.3 software (Tomovision, Montreal, QB, Canada), which enables specific tissue demarcation using previously reported Hounsfield unit (HU) thresholds.29 Skeletal muscle is identified and quantified by HU thresholds of −29 to +150. Muscles in the L3 region encompass psoas, erector spinae, quadratus lumborum, transversus abdominus, external and internal obliques, and rectus abdominus. The following HU thresholds were used for adipose tissues: −190 to −30 for subcutaneous and intermuscular adipose tissues30 and −150 to −50 for visceral adipose tissues.31 Using these specific HU thresholds, measurements of the skeletal muscle index are not influenced by the presence of ascites in patients with cirrhosis. Cross‐sectional areas (cm2) were automatically computed by summing tissue pixels and multiplying by pixel surface area. All CT images were analysed by two trained observers (C. B., and N. E.) who demonstrated an intra‐observer coefficient variation of 1.3%. Cross‐sectional area of muscle and adipose tissue was normalized for stature (cm2/m2) as reported elsewhere,18 and this value is referred to as the L3 SMI. Cutoffs for sarcopenia were based on a CT‐based study in patients with solid tumours using optimal stratification, a statistical method similar to receiver operator curve analysis, to solve specific threshold values for L3 SMI in relation to an outcome (death) (L3 SMI: ≤41 cm2/m2 for women and ≤53 cm2/m2 for men with BMI ≥25 and ≤43 cm2/m2 in patients with BMI <25).32 Muscle attenuation indirectly measures fat infiltration in muscles. Mean muscle attenuation in HU was reported for the entire muscle area at the third lumbar vertebra. We also, used previous cutoff values for muscle attenuation previously associated with mortality, specifically <41 HU in patients with a BMI up to 24.9, and <33 in those with a BMI ≥25.32 Finally, sarcopenic obesity was defined as those patients with concurrent sarcopenia and overweight or obesity (BMI > 25 kg/m2).
Statistical analyses
The Fisher's exact probability was used to compare categorical variables, and the unpaired t‐test was used to compare differences in means of continuous variables. Survival was calculated using Kaplan–Meier method, and they were compared using the Log Rank (Mantel–Cox) test. Patients were followed from the date of the CT performed for muscle indices (time zero), until the date of death, liver transplantation or last visit. As malignancy is strongly associated with muscle abnormalities,33 a survival sub‐analysis excluding patients with hepatocellular carcinoma (HCC) was performed.
Prognostic factors for mortality were analysed by Cox regression univariate and multivariate analyses. Biochemical parameters, such as serum bilirubin, creatinine, sodium and albumin, were included in the regression analysis as dimensional variables, whereas clinical variables, such as sarcopenia and myosteatosis, were entered as categorical variables (present or absent). Data are presented as the mean ± standard error of the mean in tables and text.
Results
Clinical and biochemical features of patients with sarcopenia, sarcopenic obesity and myosteatosis
Four hundred and fifty‐seven patients were men (67%), and cirrhosis aetiology was hepatitis C virus in 269 patients (40%), alcohol in 153 (23%), non‐alcoholic steatohepatitis (NASH)/cryptogenic in 96 (14%), autoimmune liver disease in 55 (8%), hepatitis B virus in 43 (6%) and others in 5 patients (1%), and 291 patients had concomitant HCC (43%).
Two hundred and ninety‐two patients had sarcopenia (43%), 135 patients had sarcopenic obesity (20%), 353 patients had myosteatosis (52%) and 176 patients had both, sarcopenia and myosteatosis (26%). In Figure 1, we illustrate the overlapping of sarcopenia, myosteatosis and obesity using a Venn diagram. Figure 2(A and B) illustrates two cirrhotic patients with severe obesity (BMI >40 kg/m2). Abdominal CT images in horizontal plane are images taken at third lumbar vertebra, and the red colour indicates skeletal muscles. CT at the left [Figure 2(A)] is from a male patient with sarcopenic obesity, with BMI of 47 kg/m2 and L3 SMI 51 cm2/m2, and the CT at the right [Figure 2(B)] is from a female patient without sarcopenia, with BMI 42 kg/m2 and L3 SMI 49 cm2/m2.
Figure 1.
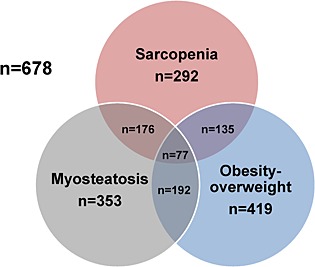
Venn diagram illustrating the association between sarcopenia, myosteatosis and obesity.
Figure 2.
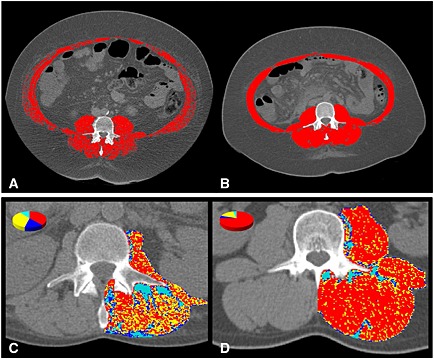
Computed tomography images used for the muscularity assessment of patients with cirrhosis. Comparison of two cirrhotic patients with severe obesity. (A) Male patient at the left had sarcopenic obesity (BMI 47 kg/m2, L3 SMI 51 cm2/m2), whereas a female patient at the right (B) had no sarcopenia (BMI 42 kg/m2, L3 SMI 49 cm2/m2). Computed tomography images used for the muscle attenuation assessment of patients with cirrhosis and comparison of two cirrhotic patients with similar BMI (28 kg/m2). (C) Patient at the left had low mean muscle attenuation (21 HU), whereas the patient at the right (D) had normal mean muscle attenuation (40 HU).
Figure 2(C and D) illustrates two cirrhotic patients with similar BMI (28 kg/m2). The patient at the left [Figure 2(C)] had myosteatosis with low mean muscle attenuation (21 HU), whereas the patient at the right [Figure 2(D)] had normal mean muscle attenuation (40 HU).
Patients with sarcopenia were more frequently men (P = 0.003), and less frequently overweight–obese (P < 0.001), had lower weight (P < 0.001), BMI (P < 0.001), L3 SMI (P < 0.001), and muscle attenuation (P < 0.001), had higher height (P < 0.001), levels of serum creatinine (P = 0.001), INR (P = 0.006), MELD (P = 0.006) and Child–Pugh scores (P < 0.001) compared with patients with no muscular abnormalities (Table 1).
Table 1.
Features associated with sarcopenia, sarcopenic obesity and myosteatosis in patients with cirrhosis
| Features | No muscular abnormalities (n = 209) | Sarcopenia (n = 292) | Sarcopenic obesity (n = 135) | Myosteatosis (n = 353) |
|---|---|---|---|---|
| Age (years) | 56 ± 1***** | 57 ± 1 | 58 ± 1***** | 58 ± 1***** |
| Gender (male:female) | 142:68*, *** | 232:59* | 113:22*** | 218:135 |
| Weight (kg) | 83 ± 1**, ***** | 77 ± 1** | 90 ± 2** | 79 ± 1***** |
| Height (cm) | 169 ± 0.5** | 174 ± 0.5** | 175 ± 0.5** | 170 ± 0.5 |
| BMI (kg/m2) | 29 ± 0.5**, ******* | 25 ± 0.5** | 30 ± 0.5 | 27 ± 0.5******* |
| Obesity–overweight | 169 (81)** | 135 (46)** | — | 192 (54)** |
| Diabetes | 27 (13) | 43 (15) | 20 (15) | 55 (16) |
| L3 SMI (cm2/m2) | 57 ± 1** | 43 ± 0.5** | 45 ± 1** | 48 ± 1** |
| Muscle attenuation (HU) | 42 ± 0.5** | 33 ± 0.5** | 32 ± 1** | 29 ± 0.5** |
| Sarcopenia | — | — | — | 176 (50) |
| Myosteatosis | — | 176 (60) | 77 (57) | — |
| Sarcopenic Obesity | — | 135 (46) | — | 77 (22) |
| Creatinine (nl, 50–115 µmol/L) | 79 ± 3**, *** | 105 ± 7*** | 114 ± 11** | 99 ± 5*** |
| INR (nl, 0.8–1.2) | 1.3 ± 0.3**, ****, ***** | 1.5 ± 0.4**** | 1.5 ± 0.2***** | 1.5 ± 0.3** |
| Albumin (nl, 35–50 g/L) | 33 ± 1******** | 33 ± 0.5 | 32 ± 1 | 32 ± 1******** |
| Bilirubin (nl, <20 µmol/L) | 67 ± 11***** | 99 ± 13 | 125 ± 19***** | 92 ± 9 |
| Sodium (nl 133–146 µmol/L) | 136 ± 1 | 135 ± 0.5 | 135 ± 1 | 135 ± 1 |
| MELD | 13 ± 1****, ****** | 15 ± 1**** | 16 ± 1****** | 15 ± 1*** |
| Child–Pugh (A/B/C) | 43/135/31** | 37/149/106** | 12/64/59** | 43/180/130** |
| Child–Pugh (points) | 8 ± 0.2** | 9 ± 0.2** | 10 ± 0.2** | 10 ± 0.2** |
| Aetiology of Cirrhosis | ||||
| Alcohol | 38 (18) | 85 (29) | 41 (30) | 86 (24) |
| HCV | 93 (44.5) | 106 (36.5) | 51 (38) | 131 (37) |
| AILDa | 15 (7) | 23 (8) | 8 (6) | 30 (9) |
| HBV | 18 (9) | 18 (6) | 8 (6) | 14 (4) |
| NASH‐Cryptogenic | 44 (21) | 59 (20) | 26 (19) | 88 (25) |
| Othersb | 1 (0.5) | 1 (0.5) | 1 (1) | 4 (1) |
| Concomitant HCC | 97 (46) | 115 (39) | 57 (42) | 145 (41) |
AILD, autoimmune liver disease; BMI, body mass index; L3 SMI, lumbar third skeletal muscle index; CI, confidence interval; HBV, hepatitis B virus; HCC, hepatocellular carcinoma; HCV, hepatitis C virus; HU, Hounsfield units; INR, international normalized ratio; MELD, model for end stage liver disease; NASH, non‐alcoholic steatohepatitis; nl, normal.
Include autoimmune hepatitis, primary biliary cirrhosis and primary sclerosing cholangitis.
Include alpha‐1‐antitrypsin deficiency, hemochromatosis and Wilson disease.
Numbers in parentheses are percentages.
Significantly different from each other at the level of
P = 0.003;
P < 0.001;
P = 0.001;
P = 0.006;
P = 0.02;
P = 0.009;
P = 0.002;
P = 0.03.
Patients with sarcopenic obesity were older (P = 0.02), and more frequently men (P = 0.001), had higher weight (P < 0.001), and height (P < 0.001), and lower L3 SMI (P < 0.001), and muscle attenuation (P < 0.001), higher levels of serum creatinine (P < 0.001), and bilirubin (P = 0.02), MELD (P = 0.009) and Child–Pugh scores (P < 0.001) compared with patients with no muscular abnormalities (Table 1).
Lastly, patients with myosteatosis were older (P = 0.02), had lower weight (P = 0.02), and lower frequency of overweight–obesity (P < 0.001), lower L3 SMI (P < 0.001), muscle attenuation (P < 0.001), and albumin (P = 0.03), and higher creatinine (P = 0.001), INR (P < 0.001), and higher MELD (P = 0.001) and Child–Pugh scores (P < 0.001) compared with patients with no muscular abnormalities (Table 1). Otherwise, there were no significant differences in clinical and biochemical features among patients with sarcopenia, sarcopenic obesity and myosteatosis and patients without muscular abnormalities as shown in Table 1.
Survival in patients with sarcopenia, sarcopenic obesity and myosteatosis
During mean follow‐up of 21 ± 1 months (range 1–164 months), 248 patients received a liver transplant (37%), 259 died (38%) and 171 (25%) were alive.
Patients with sarcopenia (22 ± 3 vs. 95 ± 22 months, P < 0.001), sarcopenic obesity (22 ± 3 vs. 95 ± 22 months, P < 0.001), and myosteatosis (28 ± 5 vs. 95 ± 22 months, P < 0.001) had worse median survival than patients without muscular abnormalities.
Six‐month probability of survival was 72%, 69% and 76% in patients with sarcopenia, sarcopenic obesity and myosteatosis, respectively, compared with 91% in patients without muscular abnormalities. The 1‐year probability of survival was 62%, 59%, 68% and 85% in the same groups, respectively (Figure 3).
Figure 3.
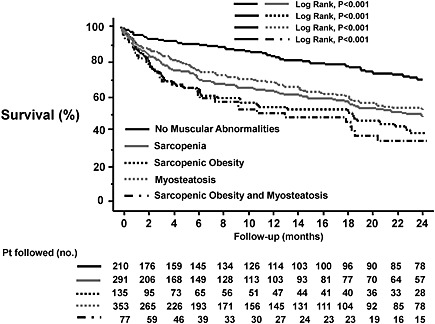
Kaplan–Meier curve indicating the survival of patients with sarcopenia (—), sarcopenic obesity (‐‐), myosteatosis (‐‐) and without muscular abnormalities (—). The 6‐month probability of survival was 72%, 69%, 76% and 91%, respectively (P < 0.001, log‐rank test). The 1‐year probability of survival was 62%, 59%, 68%, and 85% in these same groups, respectively.
Moreover, patients with either sarcopenia, sarcopenic obesity and/or myosteatosis had significantly worse survival than patients with none of these findings (29 ± 4 vs. 95 ± 22 months, P < 0.001), and patients who had both, sarcopenic obesity and myosteatosis had the worse median survival (19 ± 4 vs. 95 ± 22 months, P < 0.001).
Finally, cirrhotic patients with sarcopenia without obesity had worse median survival than non‐sarcopenic patients (22 ± 4 vs. 95 ± 16 months, P < 0.001), and patients with myosteatosis without sarcopenia had worse median survival than patients without myosteatosis (41 ± 13 vs. 95 ± 22 months, P = 0.03), whereas patients with overweight–obesity had similar survival than patients with normal BMI (41 ± 14 vs. 38 ± 6 months, P = 0.8).
Sub‐analysis in patients without hepatocellular carcinoma
In the sub‐analysis excluding the 291 patients with concomitant HCC (n = 387), patients with sarcopenia (21 ± 3 vs. 82 ± 27 months, P < 0.001), sarcopenic obesity (21 ± 2 vs. 82 ± 27 months, P < 0.001), and myosteatosis (28 ± 7 vs. 82 ± 27 months, P = 0.02) had worse median survival than patients without muscular abnormalities.
Features associated with mortality
By Cox regression analysis, biochemical values, including levels of INR (P < 0.001), albumin (P = 0.002), bilirubin (P < 0.001), sodium (P = 0.01), the L3 SMI (P < 0.001), and muscle attenuation (P < 0.001), presence of sarcopenia (P < 0.001), sarcopenic obesity (P < 0.001), myosteatosis (P = 0.003), and MELD (P < 0.001) and Child–Pugh score (P < 0.001) were significantly associated with mortality in patients with cirrhosis (Table 2).
Table 2.
Features associated with mortality by univariate Cox analysis in patients with cirrhosis
| Features associated with mortality by univariate analysis | Death (n = 259) | Alive (n = 419) | HR | 95% CI | P‐value |
|---|---|---|---|---|---|
| Age (years) | 56 ± 1 | 57 ± 1 | 0.99 | 0.97–1.01 | 0.07 |
| Gender (male:female) | 172:87 | 285:134 | 1.05 | 0.81–1.36 | 0.7 |
| Weight (kg) | 80 ± 1 | 79 ± 1 | 1.00 | 0.99–1.01 | 0.4 |
| BMI (kg/m2) | 28 ± 1 | 27 ± 1 | 1.00 | 0.98–1.02 | 0.9 |
| Obesity‐overweight | 165 (64) | 254 (61) | 1.04 | 0.80–1.34 | 0.8 |
| Diabetes | 20 (8) | 59 (14) | 0.69 | 0.45–1.10 | 0.1 |
| Creatinine (nl, 50–115 µmol/L) | 96 ± 5 | 91 ± 5 | 1.00 | 0.99–1.00 | 0.9 |
| INR (nl, 0.8–1.2) | 1.5 ± 0.4 | 1.4 ± 0.2 | 1.97 | 1.56–2.48 | <0.001 |
| Albumin (nl, 35–50 g/L) | 32 ± 1 | 33 ± 1 | 0.96 | 0.94–0.99 | 0.002 |
| Bilirubin (nl, <20 µmol/L) | 99 ± 12 | 80 ± 9 | 1.02 | 1.01–1.03 | <0.001 |
| Sodium (nl, 133–146 µmol/L) | 135 ± 1 | 136 ± 1 | 0.96 | 0.93–0.99 | 0.01 |
| L3 SMI (cm2/m2) | 49 ± 1 | 51 ± 1 | 0.98 | 0.97–0.99 | 0.001 |
| ‐Men | 52 ± 1 | 54 ± 1 | 0.97 | 0.95–0.98 | <0.001 |
| ‐Women | 52 ± 1 | 54 ± 1 | 0.98 | 0.96–1.01 | 0.3 |
| Muscle attenuation (HU) | 34 ± 1 | 36 ± 1 | 0.96 | 0.95–0.98 | <0.001 |
| Sarcopenia | 135 (52) | 157 (38) | 1.98 | 1.55–2.53 | <0.001 |
| Sarcopenic obesity | 66 (26) | 69 (17) | 1.72 | 1.30–2.28 | <0.001 |
| Myosteatosis | 145 (56) | 208 (50) | 1.45 | 1.13–1.85 | 0.003 |
| MELD Score | 15 ± 1 | 14 ± 1 | 1.05 | 1.03–1.07 | <0.001 |
| Child–Pugh (A/B/C) | 27/161/71 | 78/215/126 | 1.43 | 1.17–1.74 | <0.001 |
| Child–Pugh (points) | 9 ± 0.2 | 9 ± 0.2 | 1.07 | 1.01–1.14 | 0.02 |
| Alcohol cirrhosis | 69 (27) | 84 (20) | 1.15 | 0.87–1.52 | 0.3 |
| HCV cirrhosis | 99 (38) | 169 (40) | 1.16 | 0.91–1.50 | 0.2 |
| AILDa | 16 (6) | 39 (9) | 0.74 | 0.44–1.22 | 0.2 |
| HBV cirrhosis | 16 (6) | 27 (6) | 1.17 | 0.71–1.94 | 0.5 |
| NASH‐cryptogenic cirrhosis | 55 (21) | 98 (23) | 0.72 | 0.53–0.97 | 0.03 |
| Concomitant HCC | 107 (41) | 184 (44) | 0.89 | 0.69–1.15 | 0.4 |
AILD, autoimmune liver disease; BMI, body mass index; CI, confidence interval; HBV, hepatitis B virus; HCC, hepatocellular carcinoma; HCV, hepatitis C virus; HR, hazard ratio; INR, international normalized ratio; MELD, model for end stage liver disease; NASH, non‐alcoholic steatohepatitis; nl, normal.
Include autoimmune hepatitis, primary biliary cirrhosis and primary sclerosing cholangitis.
In the multivariate Cox analysis including the presence of age, sodium, sarcopenia, myosteatosis, MELD, Child–Pugh and NASH cirrhosis (excluding INR, albumin and bilirubin to avoid colinearity, as they are included in either Child–Pugh or MELD scores. Also sarcopenic obesity was not included, as this is a subset of sarcopenia), only sarcopenia [hazard ratio (HR) 2.00, P < 0.001], myosteatosis (HR 1.42, P = 0.04), MELD (HR 1.04, P = 0.001) and NASH cirrhosis (HR 0.60, P = 0.01) were independently associated with mortality (Table 3).
Table 3.
Features associated with mortality by multivariate Cox analysis in patients with cirrhosis
| Features associated with mortality by multivariate analysis | Death (n = 259) | Alive (n = 419) | HR | 95% CI | P‐value |
|---|---|---|---|---|---|
| Age (years) | 56 ± 1 | 57 ± 1 | 0.99 | 0.97–1.02 | 0.8 |
| Sodium (nl, 133–146 µmol/L) | 135 ± 1 | 136 ± 1 | 0.97 | 0.93–1.01 | 0.1 |
| Sarcopenia | 135 (52) | 157 (38) | 2.00 | 1.44–2.77 | <0.001 |
| Myosteatosis | 145 (56) | 208 (50) | 1.42 | 1.02–1.99 | 0.04 |
| MELD score | 15 ± 1 | 14 ± 1 | 1.04 | 1.02–1.07 | 0.001 |
| Child–Pugh (points) | 9 ± 0.2 | 9 ± 0.2 | 0.92 | 0.85–1.01 | 0.07 |
| NASH‐cryptogenic cirrhosis | 55 (21) | 98 (23) | 0.60 | 0.40–0.89 | 0.01 |
CI, confidence interval; HR, hazard ratio; MELD, model for end stage liver disease; NASH, non‐alcoholic steatohepatitis; nl, normal.
Numbers in parentheses are percentages.
Variables included in the multivariate analysis were age, sodium, sarcopenia, myosteatosis, MELD, Child–Pugh, and NASH cirrhosis. INR, bilirubin and albumin were not included to avoid colinearity, as they are included in either Child–Pugh or MELD scores. Also sarcopenic obesity was not included, as this is a subset of sarcopenia.
Causes of death in patients with sarcopenia, sarcopenic obesity and myosteatosis
Of the 259 patients who died, 54 patients (21%) died from liver failure, 69 (27%) died from sepsis, 43 (17%) died from HCC progression, 18 (7%) died from hepatorenal syndrome, 9 patients (3%) died from variceal bleeding and 66 patients (25%) died from other reasons (cardiac arrest, cerebrovascular events, trauma, extrahepatic malignancies, unknown and others).
In the analysis of the 259 who died, the frequency of sepsis‐related death was significantly higher in cirrhotic patients with sarcopenia [49 (36%) vs. 20 (16%), P < 0.001; Figure 4(A)], myosteatosis [47 (32%) vs. 22 (19%), P = 0.02; Figure 4(B)], and sarcopenic obesity [24 (36%) vs. 45 (23%), P = 0.05; Figure 4(C)] than patients without muscular abnormalities. Finally, patients without myosteatosis had higher frequency of liver failure‐related death [31 (27%) vs. 23 (16%), P = 0.03; Figure 4(B)] than patients with myosteatosis. Otherwise, there were no significant differences in the frequency of death related to liver failure, HCC progression, hepatorenal syndrome, variceal bleeding and other aetiologies among patients with and without muscular abnormalities [Figure 4(A–C)].
Figure 4.
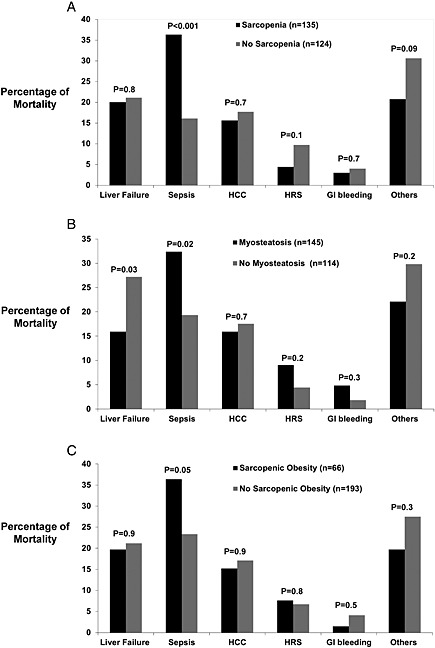
Percentage of mortality related to liver failure, sepsis, hepatocellular carcinoma progression, variceal bleeding, hepatorenal syndrome and others in cirrhotic patients with (A) sarcopenia, (B) myosteatosis and (C) sarcopenic obesity. GI, gastrointestinal; HCC, hepatocellular carcinoma; HRS, hepatorenal syndrome.
Outcomes after liver transplantation in patients with sarcopenia, sarcopenic obesity and myosteatosis
Two‐hundred and forty‐eight patients had a liver transplant, and of them 112 (45%) had sarcopenia, 42 (17%) had sarcopenic obesity and 116 (47%) had myosteatosis. Median survival after liver transplant was not different among sarcopenic and non‐sarcopenic patients (117 ± 17 vs. 146 ± 19 months, P = 0.4), patients with and without sarcopenic obesity (114 ± 8 vs. 132 ± 112 months, P = 0.1), nor patients with and without myosteatosis (117 ± 19 vs. 142 ± 17 months, P = 0.1).
Sarcopenic patients had longer hospital stay (40 ± 4 vs. 25 ± 3 days, P = 0.001) and intensive care unit stay after liver transplantation (12 ± 2 vs. 6 ± 1 days, P = 0.005) than non‐sarcopenic patients. Patients with myosteatosis had longer intensive care unit stay (11 ± 2 vs. 6 ± 1 days, P = 0.02) than patients without myosteatosis, but no significant differences in hospital stay (36 ± 3 vs. 28 ± 3 days, P = 0.09), and patients with sarcopenic obesity had no differences in hospital (35 ± 6 vs. 31 ± 2 days, P = 0.6) and intensive care unit stay (8 ± 2 vs. 8 ± 1 days, P = 0.9) than patients without sarcopenic obesity.
Finally, bacterial infections within the first 90 days after liver transplantation were more frequent for sarcopenic than non‐sarcopenic patients (26 vs. 15%, P = 0.04), but no significant differences in bacterial infections were observed between patients with sarcopenic obesity (26 vs. 19%, P = 0.2) and myosteatosis (20 vs. 20%, P = 0.6), compared with patients without these muscular abnormalities.
Discussion
Our study indicates that skeletal muscle abnormalities are frequently present in patients with cirrhosis, with sarcopenia being present in almost half of the patients; twenty percent of them have sarcopenic obesity and fatty infiltration of skeletal muscle or myosteatosis being present in more than half of cirrhotic patients.
Patients with cirrhosis and sarcopenia, sarcopenic obesity and myosteatosis tend to be older, more frequently men and have worse liver function assessed by MELD or Child–Pugh scores compared with patients with no muscular abnormalities (Table 1).
Importantly, the presence of sarcopenia, sarcopenic obesity and myosteatosis were associated with worse survival compared with cirrhotic patients with no muscular abnormalities. In fact, our study indicates that having sarcopenia and myosteatosis increase the risk of mortality by 1.5‐ to twofold compared with patients who do not have any of these muscular abnormalities.
The risk of mortality associated with the presence of muscular abnormalities (sarcopenia and myosteatosis) in cirrhotic patients seems to be related to a higher frequency of sepsis‐related death (Figure 1). These findings are similar to a recent study that found correlation between protein malnutrition and sepsis in a cohort of hospitalized cirrhotic patients,34 and this might explain why conventional scores that reflect mainly liver function, such as MELD and Child–Pugh, do not detect mortality risks associated with skeletal muscle abnormalities.10
Muscle wasting and fatty muscle infiltration in cirrhotic patients are part of the frailty complex present in these patients, characterized as decreased reserve and resistance to stressors, resulting from cumulative declines across multiple physiologic systems and predisposition to poor outcomes.20 Therefore, muscularity assessment including the L3 SMI and muscle attenuation index are objective and reproducible, and their assessment is not biased by overweight–obesity and fluid overload status that frequently is present in patients with decompensated cirrhosis. Moreover, skeletal muscle abnormalities in patients with cirrhosis seem to reflect a chronic detriment in the general physical condition, rather than acute severity of the liver disease.
The pathogenesis of sarcopenia and myosteatosis in cirrhotic patients is not completely elucidated, but it seems to be the result of a complex interaction involving dysregulation of fatty acid oxidation and ketogenesis, gluconeogenesis from amino acids, glycogenolysis and selective utilization of aromatic amino acids in the liver and branched chain amino acids in the skeletal muscle.35, 36 Proinflammatory cytokines, tumour necrosis factor‐α, interleukin‐6 and C‐reactive protein have been shown to mediate skeletal muscle catabolism, leading to sarcopenia.37 Also, there is impairment of skeletal muscle protein synthesis in portosystemic shunting because of an increased expression of myostatin, a member of the transforming growth factor beta superfamily,38, 39 and autophagy in skeletal muscle mediated by hyperammonemia.40
One limitation of our study is that we used a definition of sarcopenia based on cut‐point values validated in a different population,32 as predefined values for sarcopenia in patients with cirrhosis have not been validated; however, the values we used were derived from optimum stratification of the L3 SMI, finding the most significant P‐values to define gender‐specific cut‐points associated with mortality in patients with malignancy and obesity.32 We have already demonstrated that these values are useful to distinguish cirrhotic patients with sarcopenia and higher risk of mortality,10 and cut‐point values are very similar to a preliminary experience in patients with cirrhosis.41 Other potential limitation is that our cohort of cirrhotic patients was mainly composed of either patients with advanced liver disease or with HCC, so our results may not reflect the broader population of cirrhosis. The prevalence of muscular abnormalities may be lower in a population‐based cohort of cirrhotics.
In summary, despite the fact that skeletal muscle abnormalities, such as sarcopenia and myosteatosis, are not included in the conventional scores for prognosis in cirrhotic patients, such as the MELD or Child–Pugh scores, its presence should alert clinicians to the same extent as other complications do, such as ascites, hepatic encephalopathy or variceal bleeding.13, 14
As sarcopenia and myosteatosis are frequent complications in cirrhotic patients and are predictive of longer hospital stays and a higher risk of perioperative bacterial infections after liver transplantation, but are not associated with increased post‐liver transplant mortality,42 modification of current allocation systems to include muscle abnormalities may decrease mortality in patients with cirrhosis awaiting for liver transplantation.
Cirrhotic patients are frequently overweight or obese, and body composition assessments with CT images help to disclose otherwise occult sarcopenia and/or myosteatosis. Cirrhotic patients with sarcopenia and myosteatosis have a worse prognosis compared with patients with no skeletal muscular abnormalities, regardless of overall body weight or BMI, mainly to higher risk of sepsis‐related mortality.
Funding
This study has been funded by a Clinical Research Award from the American College of Gastroenterology Institute 2011.
Conflict of interest
None declared.
Acknowledgements
The authors of this paper certify that they comply with the ethical guidelines for authorship and publishing in the Journal of Cachexia, Sarcopenia, and Muscle 2010;1:7–8 (von Haehling S., Morley J. E., Coats A. J., and Anker S. D.).
Presented in part at the Annual Liver Meeting of the American Association for the Study of Liver Diseases, 4 November 2013; Washington, DC.
Montano‐Loza, A. J. , Angulo, P. , Meza‐Junco, J. , Prado, C. M. M. , Sawyer, M. B. , Beaumont, C. , Esfandiari, N. , Ma, M. , and Baracos, V. E. (2016) Sarcopenic obesity and myosteatosis are associated with higher mortality in patients with cirrhosis. Journal of Cachexia, Sarcopenia and Muscle, 7: 126–135. doi: 10.1002/jcsm.12039.
References
- 1. Popkin BM, Adair LS, Ng SW. Global nutrition transition and the pandemic of obesity in developing countries. Nutr Rev 2012; 70: 3–21. [DOI] [PMC free article] [PubMed] [Google Scholar]
- 2. Ogden CL, Yanovski SZ, Carroll MD, Flegal KM. The epidemiology of obesity. Gastroenterology 2007; 132: 2087–102. [DOI] [PubMed] [Google Scholar]
- 3. Everhart JE, Lok AS, Kim HY, Morgan TR, Lindsay KL, Chung RT, et al Weight‐related effects on disease progression in the hepatitis C antiviral long‐term treatment against cirrhosis trial. Gastroenterology 2009; 137: 549–57. [DOI] [PMC free article] [PubMed] [Google Scholar]
- 4. Raynard B, Balian A, Fallik D, Capron F, Bedossa P, Chaput JC, et al Risk factors of fibrosis in alcohol‐induced liver disease. Hepatology 2002; 35: 635–8. [DOI] [PubMed] [Google Scholar]
- 5. Berzigotti A, Garcia‐Tsao G, Bosch J, Grace ND, Burroughs AK, Morillas R, et al Obesity is an independent risk factor for clinical decompensation in patients with cirrhosis. Hepatology 2010; 54: 555–61. [DOI] [PMC free article] [PubMed] [Google Scholar]
- 6. Meza‐Junco J, Montano‐Loza AJ, Baracos VE, Prado CM, Bain VG, Beaumont C, et al Sarcopenia as a prognostic index of nutritional status in concurrent cirrhosis and hepatocellular carcinoma. J Clin Gastroenterol 2013; 47: 861–70. [DOI] [PubMed] [Google Scholar]
- 7. Kaido T, Ogawa K, Fujimoto Y, Ogura Y, Hata K, Ito T, et al. Impact of sarcopenia on survival in patients undergoing living donor liver transplantation. American Journal of Transplantation: Official Journal of the American Society of Transplantation and the American Society of Transplant Surgeons 2013; 13: 1549–56. [DOI] [PubMed] [Google Scholar]
- 8. Krell RW, Kaul DR, Martin AR, Englesbe MJ, Sonnenday CJ, Cai S, et al. Association between sarcopenia and the risk of serious infection among adults undergoing liver transplantation. Liver Transpl 2013; 19: 1396–402. [DOI] [PMC free article] [PubMed] [Google Scholar]
- 9. Englesbe MJ, Patel SP, He K, Lynch RJ, Schaubel DE, Harbaugh C, et al. Sarcopenia and mortality after liver transplantation. J Am Coll Surg 2010; 211: 271–8. [DOI] [PMC free article] [PubMed] [Google Scholar]
- 10. Montano‐Loza AJ, Meza‐Junco J, Prado CM, Lieffers JR, Baracos VE, Bain VG, et al Muscle wasting is associated with mortality in patients with cirrhosis. Clin Gastroenterol Hepatol 2012; 10: 166–73. [DOI] [PubMed] [Google Scholar]
- 11. Johnson TM, Overgard EB, Cohen AE, DiBaise JK. Nutrition assessment and management in advanced liver disease. Nutr Clin Pract 2013; 28: 15–29. [DOI] [PubMed] [Google Scholar]
- 12. O'Brien A, Williams R. Nutrition in end‐stage liver disease: principles and practice. Gastroenterology 2008; 134: 1729–40. [DOI] [PubMed] [Google Scholar]
- 13. Montano‐Loza AJ. New concepts in liver cirrhosis: clinical significance of sarcopenia in cirrhotic patients. Minerva Gastroenterol Dietol 2013; 59: 173–86. [PubMed] [Google Scholar]
- 14. Montano‐Loza AJ. Muscle wasting: a nutritional criterion to prioritize patients for liver transplantation. Curr Opin Clin Nutr Metab Care 2014; 17: 219–25. [DOI] [PubMed] [Google Scholar]
- 15. Masuda T, Shirabe K, Ikegami T, Harimoto N, Yoshizumi T, Soejima Y, et al. Sarcopenia is a prognostic factor in living donor liver transplantation. Liver Transplant 2014; 20: 401–7. [DOI] [PubMed] [Google Scholar]
- 16. Tsien C, Shah SN, McCullough AJ, Dasarathy S. Reversal of sarcopenia predicts survival after a transjugular intrahepatic portosystemic stent. Eur J Gastroen Hepat 2013; 25: 85–93. [DOI] [PubMed] [Google Scholar]
- 17. Durand F, Buyse S, Francoz C, Laouenan C, Bruno O, Belghiti J, et al. Prognostic value of muscle atrophy in cirrhosis using psoas muscle thickness on computed tomography. J Hepatol 2014; 60: 1151–7. [DOI] [PubMed] [Google Scholar]
- 18. Mourtzakis M, Prado CM, Lieffers JR, Reiman T, McCargar LJ, Baracos VE. A practical and precise approach to quantification of body composition in cancer patients using computed tomography images acquired during routine care. Appl Physiol Nutr Metab 2008; 33: 997–1006. [DOI] [PubMed] [Google Scholar]
- 19. Dasarathy S. Consilience in sarcopenia of cirrhosis. J Cachexia Sarcopenia Muscle 2012; 3: 225–37. [DOI] [PMC free article] [PubMed] [Google Scholar]
- 20. Lang PO, Michel JP, Zekry D. Frailty syndrome: a transitional state in a dynamic process. Gerontology 2009; 55: 539–49. [DOI] [PubMed] [Google Scholar]
- 21. Baumgartner RN, Koehler KM, Gallagher D, Romero L, Heymsfield SB, Ross RR, et al Epidemiology of sarcopenia among the elderly in New Mexico. Am J Epidemiol 1998; 147: 755–63. [DOI] [PubMed] [Google Scholar]
- 22. Lang T, Streeper T, Cawthon P, Baldwin K, Taaffe DR, Harris TB. Sarcopenia: etiology, clinical consequences, intervention, and assessment. Osteoporos Int 2010; 21: 543–59. [DOI] [PMC free article] [PubMed] [Google Scholar]
- 23. Janssen I. Evolution of sarcopenia research. Appl Physiol Nutr Metab 2010; 35: 707–12. [DOI] [PubMed] [Google Scholar]
- 24. Schrager MA, Metter EJ, Simonsick E, Ble A, Bandinelli S, Lauretani F, et al. Sarcopenic obesity and inflammation in the InCHIANTI study. J Appl Physiol 2007; 102: 919–25. [DOI] [PMC free article] [PubMed] [Google Scholar]
- 25. Kim TN, Park MS, Lim KI, Choi HY, Yang SJ, Yoo HJ, et al. Relationships between sarcopenic obesity and insulin resistance, inflammation, and vitamin D status: the Korean Sarcopenic Obesity Study. Clin Endocrinol (Oxf) 2013; 78: 525–32. [DOI] [PubMed] [Google Scholar]
- 26. Gallagher D, Kuznia P, Heshka S, Albu J, Heymsfield SB, Goodpaster B, et al. Adipose tissue in muscle: a novel depot similar in size to visceral adipose tissue. Am J Clin Nutr 2005; 81: 903–10. [DOI] [PMC free article] [PubMed] [Google Scholar]
- 27. Petersen KF, Befroy D, Dufour S, Dziura J, Ariyan C, Rothman DL, et al. Mitochondrial dysfunction in the elderly: possible role in insulin resistance. Science 2003; 300: 1140–2. [DOI] [PMC free article] [PubMed] [Google Scholar]
- 28. Visser M, Goodpaster BH, Kritchevsky SB, Newman AB, Nevitt M, Rubin SM, et al. Muscle mass, muscle strength, and muscle fat infiltration as predictors of incident mobility limitations in well‐functioning older persons. J Gerontol A Biol Sci Med Sci 2005; 60: 324–33. [DOI] [PubMed] [Google Scholar]
- 29. Mitsiopoulos N, Baumgartner RN, Heymsfield SB, Lyons W, Gallagher D, Ross R. Cadaver validation of skeletal muscle measurement by magnetic resonance imaging and computerized tomography. J Appl Physiol 1998; 85: 115–22. [DOI] [PubMed] [Google Scholar]
- 30. Kvist H, Sjostrom L, Tylen U. Adipose tissue volume determinations in women by computed tomography: technical considerations. Int J Obes 1986; 10: 53–67. [PubMed] [Google Scholar]
- 31. Vehmas T, Kairemo KJ, Taavitsainen MJ. Measuring visceral adipose tissue content from contrast enhanced computed tomography. Int J Obes Relat Metab Disord 1996; 20: 570–3. [PubMed] [Google Scholar]
- 32. Martin L, Birdsell L, Macdonald N, Reiman T, Clandinin MT, McCargar LJ, et al. Cancer cachexia in the age of obesity: skeletal muscle depletion is a powerful prognostic factor, independent of body mass index. J Clin Oncol 2013; 31: 1539–47. [DOI] [PubMed] [Google Scholar]
- 33. Vaughan VC, Martin P, Lewandowski PA. Cancer cachexia: impact, mechanisms and emerging treatments. J Cachexia Sarcopenia Muscle 2013; 4: 95–109. [DOI] [PMC free article] [PubMed] [Google Scholar]
- 34. Merli M, Lucidi C, Giannelli V, Giusto M, Riggio O, Falcone M, et al. Cirrhotic patients are at risk for health care‐associated bacterial infections. Clin Gastroenterol Hepatol 2010; 8: 979–85. [DOI] [PubMed] [Google Scholar]
- 35. Owen OE, Reichle FA, Mozzoli MA, Kreulen T, Patel MS, Elfenbein IB, et al Hepatic, gut, and renal substrate flux rates in patients with hepatic cirrhosis. J Clin Invest 1981; 68: 240–52. [DOI] [PMC free article] [PubMed] [Google Scholar]
- 36. Kondrup J, Nielsen K, Hamberg O. Nutritional therapy in patients with liver cirrhosis. Eur J Clin Nutr 1992; 46: 239–46. [PubMed] [Google Scholar]
- 37. Beyer I, Mets T, Bautmans I. Chronic low‐grade inflammation and age‐related sarcopenia. Curr Opin Clin Nutr Metab Care 2012; 15: 12–22. [DOI] [PubMed] [Google Scholar]
- 38. Dasarathy S, McCullough AJ, Muc S, Schneyer A, Bennett CD, Dodig M, et al Sarcopenia associated with portosystemic shunting is reversed by follistatin. J Hepatol 2011; 54: 915–21. [DOI] [PMC free article] [PubMed] [Google Scholar]
- 39. Taylor WE, Bhasin S, Artaza J, Byhower F, Azam M, Willard DH Jr, et al. Myostatin inhibits cell proliferation and protein synthesis in C2C12 muscle cells. Am J Physiol Endocrinol Metab 2001; 280: E221–8. [DOI] [PubMed] [Google Scholar]
- 40. Qiu J, Tsien C, Thapalaya S, Narayanan A, Weihl CC, Ching JK, et al. Hyperammonemia‐mediated autophagy in skeletal muscle contributes to sarcopenia of cirrhosis. Am J Physiol Endocrinol Metab 2012; 303: E983–93. [DOI] [PMC free article] [PubMed] [Google Scholar]
- 41. Montano‐Loza AJ, Meza‐Junco J, Prado CM, Tandon P, Bain VG, Ma M, et al. New cutoff values for sarcopenia for predicting 6‐months mortality in cirrhotic patients. J Hepatol 2013; 58: S95. [Google Scholar]
- 42. Montano‐Loza AJ, Meza‐Junco J, Baracos VE, Prado CM, Ma M, Meeberg G, et al. Severe muscle depletion predicts postoperative length of stay but is not associated with survival after liver transplantation. Liver Transpl 2014; 20: 640–8. [DOI] [PubMed] [Google Scholar]