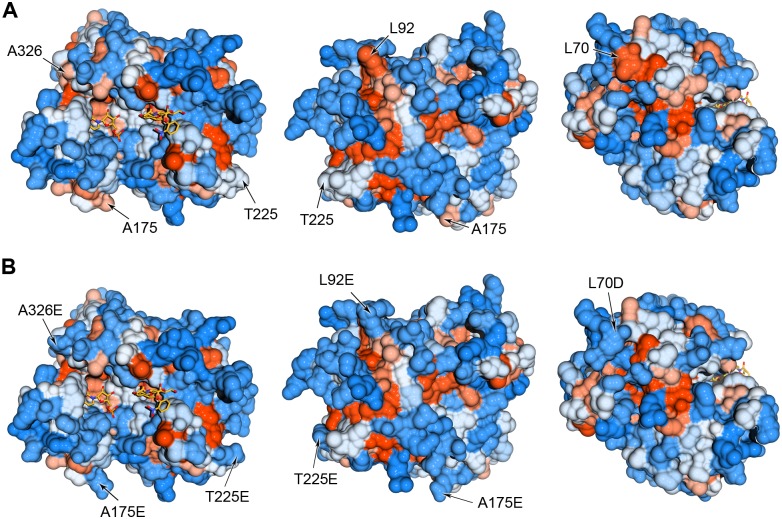
Fig 7. Models of wild type hST3Gal1 (A) and variant hST3Gal1-5x (B).
Position of mutations L70D, L92E, A175E, T225E and A326E are indicated by arrows. The scale for hydrophobicity shows amino acids with colors ranging from blue for the most hydrophilic to orange red for the most hydrophobic. Figures and in silico mutations on the model were created using UCSF Chimera[29].

