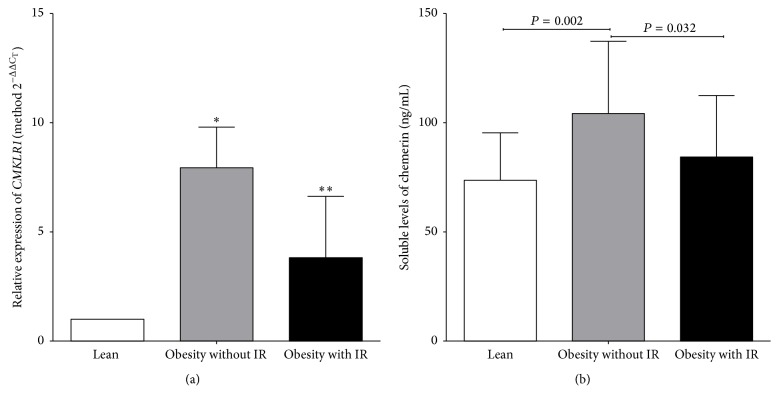
Figure 2.
Levels of soluble chemerin and relative expression of CMKLR1 in the study groups. (a) Relative expression of CMKLR1. Method 2−ΔΔCT: ∗difference between obesity without IR and lean (7.9-fold; P = 0.003), and ∗∗obesity with IR versus lean (3.8-fold; P < 0.001). (b) Serum levels of chemerin (ANOVA, Tukey post hoc). IR: insulin resistance.

