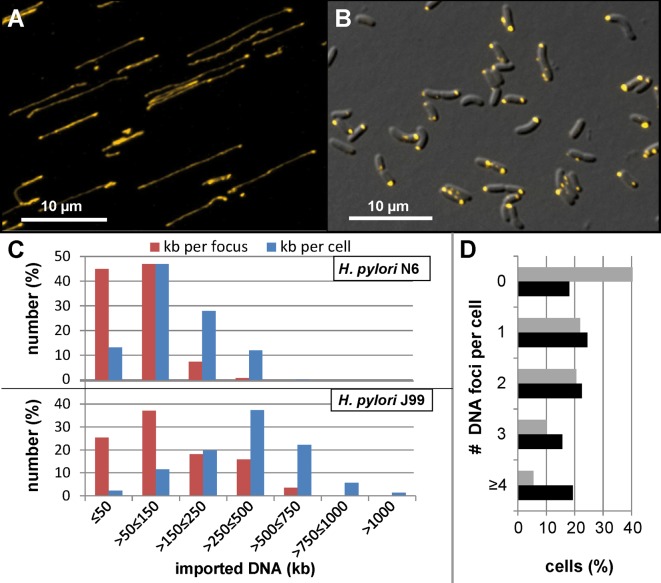
Fig 2. Quantification of imported DNA into H. pylori cells.
A, Cy3 image of single Cy3-labelled λ DNA molecules, stained in yellow; B, DIC/Cy3 overlay image of H. pylori J99 after 10 min of DNA uptake under microaerobic conditions; C, results of the quantitative analysis of DNA uptake. For H. pylori, fluorescence intensity in single DNA foci (red) and in whole cells (blue) was determined in two different wild type strains (N6 and J99) after microaerobic growth in TSB-FBS into competent phase. D, histogram of the number of foci per cell. Grey bars, strain N6; black bars, strain J99. Fluorescence intensity was compared to that of single λ DNA molecules and expressed as imported kb. The images were acquired using a Zeiss Axio Observer Z1 and ZEN software, blue edition, version 2.0.0.0. ncells = 928 or 1483 and nfoci = 1903 or 1740 were analyzed for J99 or N6, respectively.

