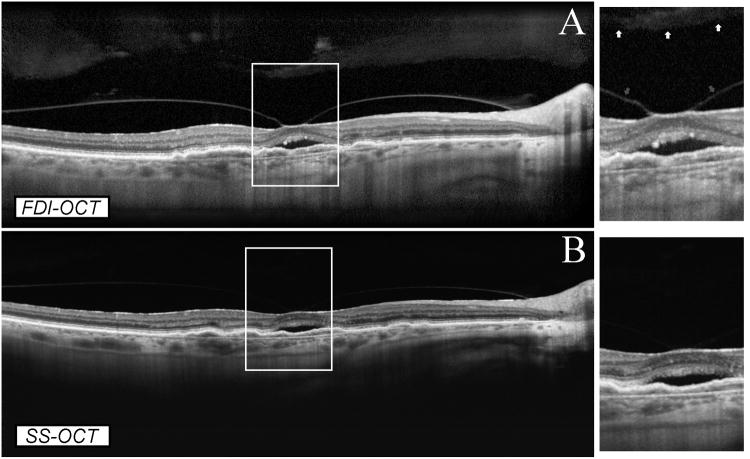
Figure 3.
Comparison between FDI SD-OCT (A) and SS-OCT (B) in full-depth visualization of posterior ocular structures in an eye with wet AMD. Both OCT modalities showed clearly the full thickness of the retina and choroid. However, SD-OCT imaging nicely showed the presence of the premacular bursa with vitreomacular traction, which was barely evident on SS-OCT imaging in magnified visualization.

