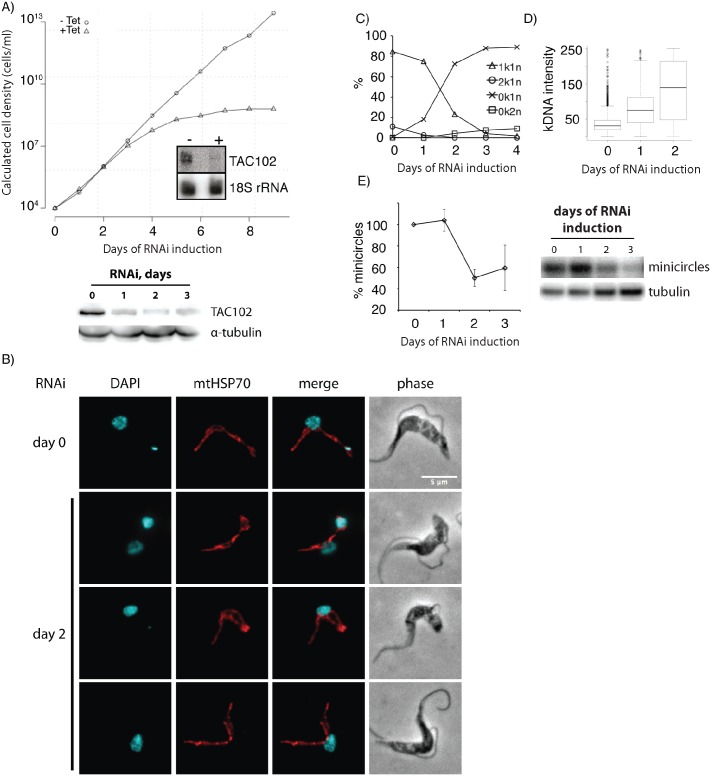
Fig 1. RNAi against TAC102 in BSF cells causes missegregation and loss of kDNA.
A–growth curve of cells uninduced (−Tet) and induced (+Tet) for TAC102 RNAi. Inset: northern blot probed for TAC102 and 18S rRNA (loading control). RNA was isolated from cells that were uninduced (−) or induced for two days (+). The western blot under the growth curve demonstrates downregulation of TAC102 protein upon induction of RNAi, α-tubulin was used as a loading control. B–immunofluorescence images showing missegregation and loss of kDNA as well as the unchanged mitochondrial morphology upon induction of RNAi against TAC102. DNA is stained with DAPI (cyan). Mitochondria are visualized by staining for the mitochondrial heat-shock protein 70 (mtHSP70, red). Scale bar 5 μm. C–percentage of cells with different k-n-combinations within the course of TAC102 RNAi. D–intensity of the kDNA signal measured by DAPI staining. E–the relative amount of minicircle DNA decreases within the course of TAC102 RNAi, according to Southern blotting, α-tubulin was used for normalization and the amount of minicircle DNA in non-induced cells (day 0) was taken as 100%. A representative Southern blot is shown on the right side of the graph.

