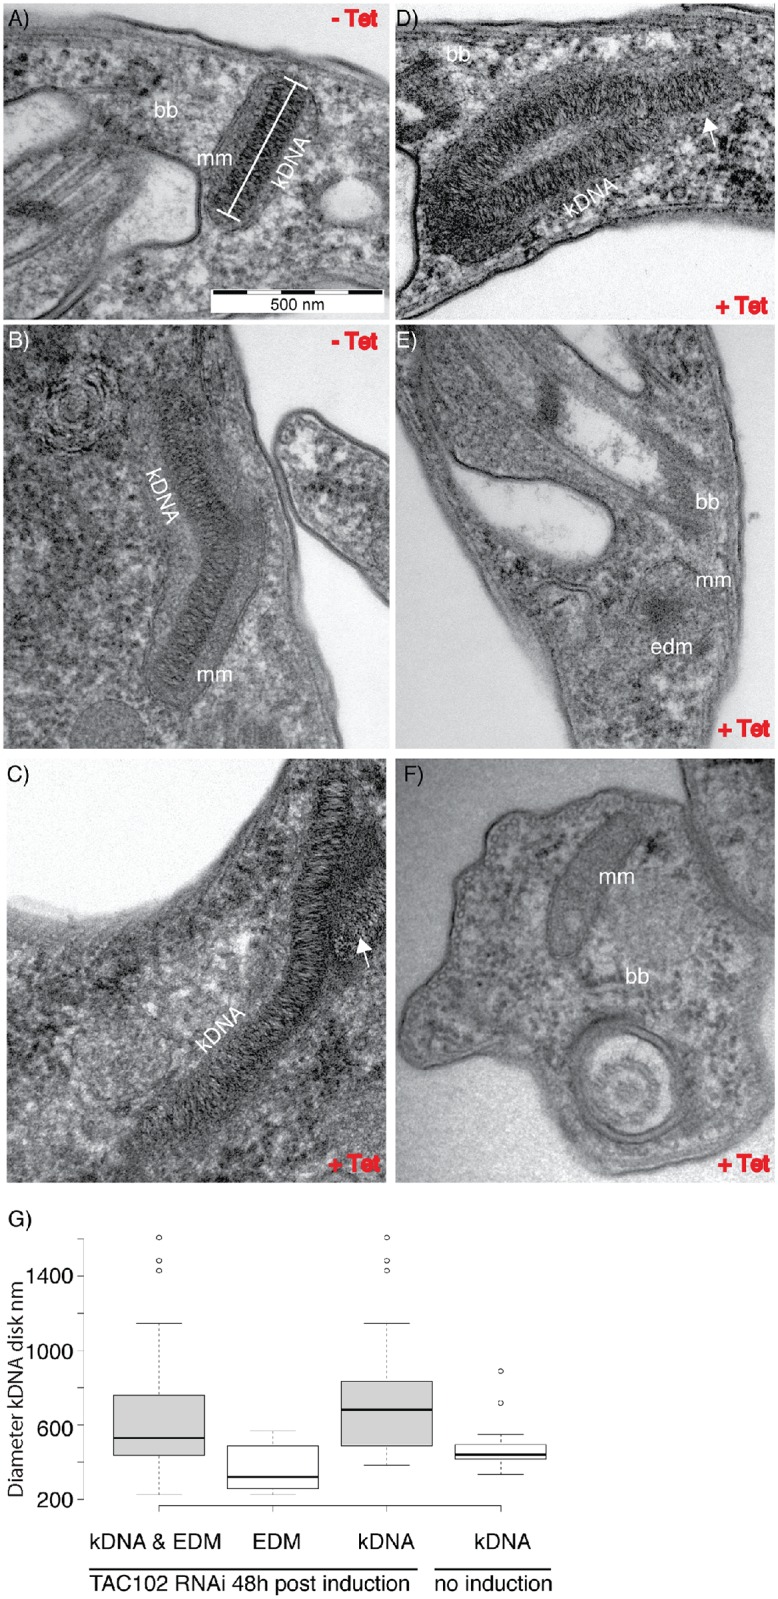
Fig 2. Ultrastructure of kDNA upon RNAi against TAC102 in BSF cells revealed by transmission electron microscopy.

bb, basal body; mm, mitochondrial membrane; edm, electron dense material; −Tet, non-induced cells; +Tet, cells with TAC102 RNAi induced for two days. A,B–kDNA in a non-induced cells. C,D–examples of enlarged kDNA in cells induced for TAC102 RNAi for two days. The arrows point at additional patches of kDNA. E–example of a cell induced for TAC102 RNAi for two days that has lost the kDNA, instead only a small patch of electron dense material (edm) can be seen surrounded by the mitochondrial membrane (mm) and localized in the proximity to the basal body (bb). F–an example of a cell induced for TAC102 RNAi for two days that has lost the kDNA and does not have any detectable electron dense material (edm); however, the mitochondrial membrane (mm) and the basal body (bb) are seen well. G–quantification of the kDNA diameter, measured as shown in A (white bar), in non-induced and induced cells.
