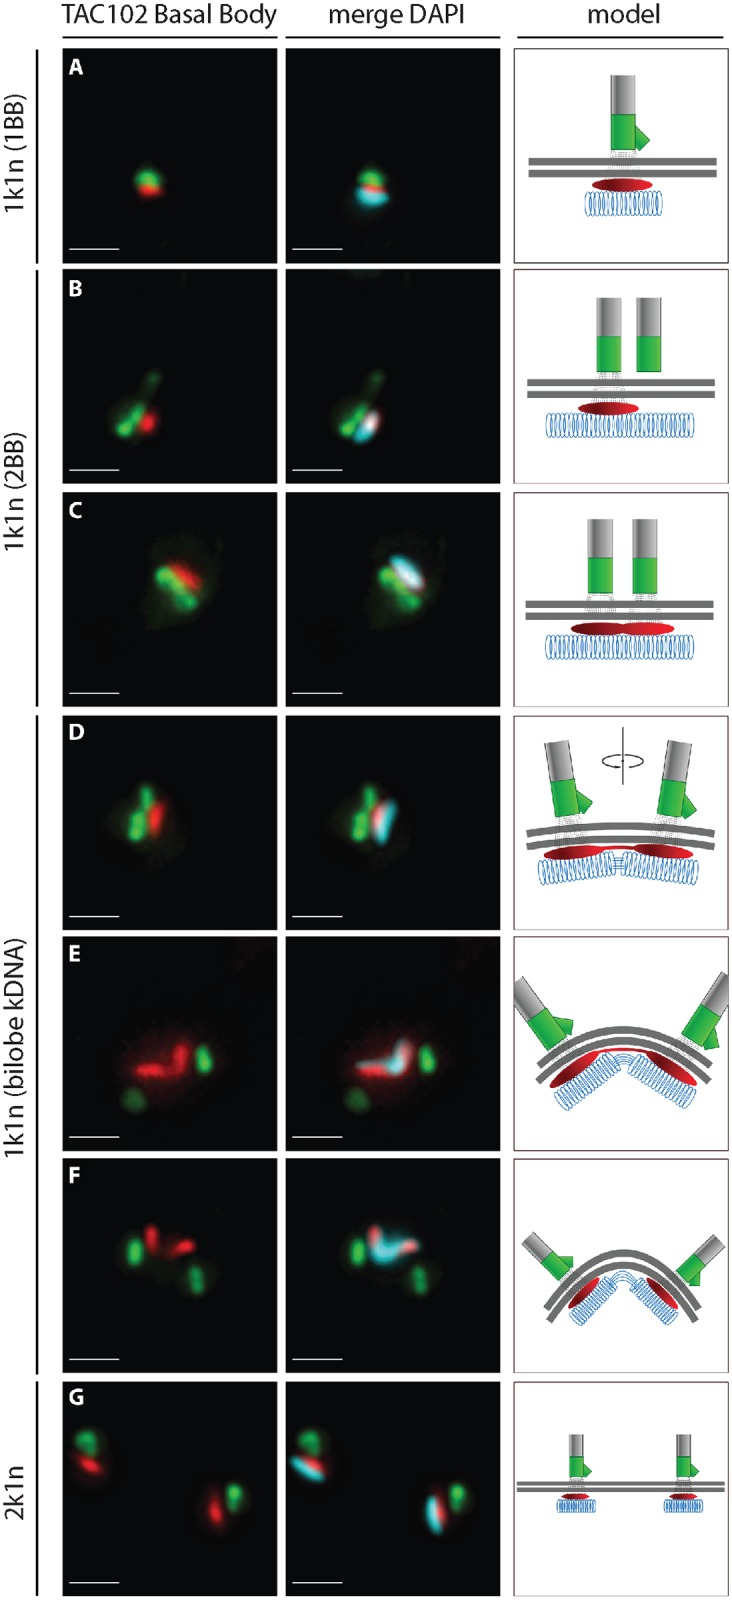
Fig 6. Localization of TAC102 in BSF T. brucei during different stages of kDNA replication.

Immunofluorescence images show the localization of N-PTP-TAC102 (detected by anti-Protein A antibody, red), the basal body (YL1/2, green) and the kDNA (stained with DAPI, cyan). A schematic model corresponding to each situation is shown on the right side of the images. Panels A—G represent different stages during kDNA replication. Scale bar 1 μm.
