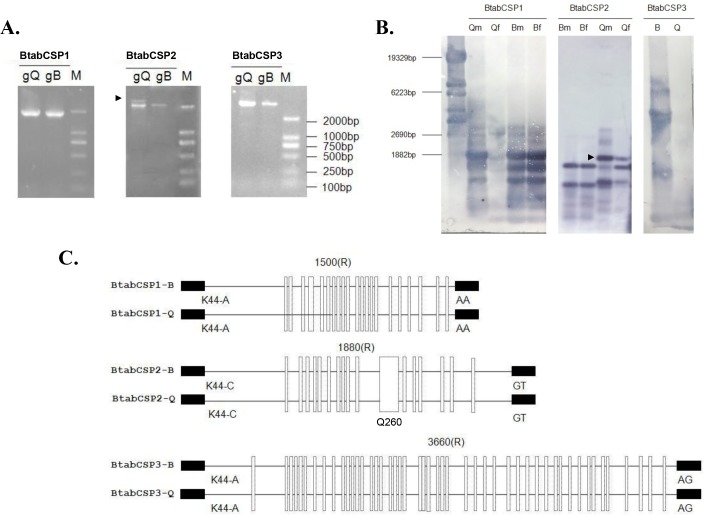
Fig 2. Identification of B. tabaci CSP1, CSP2 and CSP3 gene structures in B and Q biotypes.
(A) Agarose gel electrophoretic analysis of genomic DNA PCR products from B and Q biotype using specific CSP1, CSP2 and CSP3 primers. (B) Southern blot analysis of genomic DNA PCR products isolated from B. tabaci in B and Q-biotype. Qm: Q males, Qf: Q females, Bm: B males; Bf: B females. A mixed pool of males and females were used for blot hybridized with CSP3 probe. Size markers (bps) are from HindIII-digested lambda DNA. The arrow tip shows CSP2-DNA band specific to Q. (C) Comparative analysis of gene structures encoding CSP1, CSP2 and CSP3 in B and Q biotypes of B. tabaci. Exon/intron boundaries (the first base of codon for K/R at position 45) were determined by comparing complementary and genomic DNA encoding CSP1, CSP2 and CSP3, respectively (KM078671-KM78697). Exons are represented by small black boxes, introns by straight black lines. The number above indicates the intron size. Mutation sites between B and Q for each CSP gene are shown by white vertical rectangles. Q260 indicates the position of intron motif specific to Q [38].

