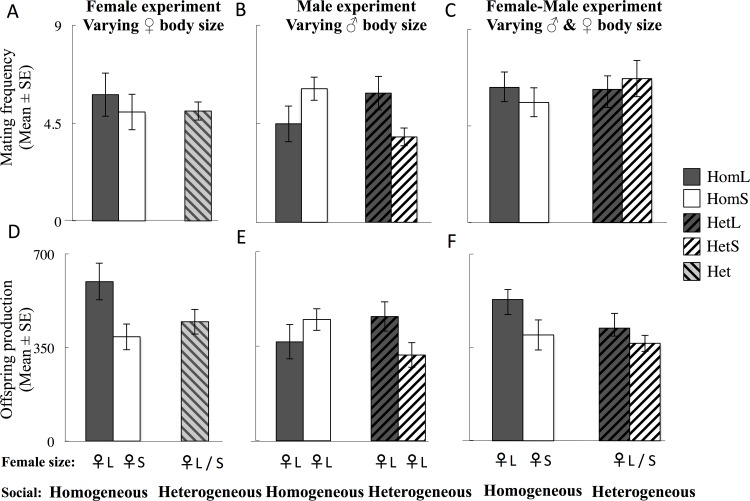
Fig 4. Effects of larval environment on focal male reproduction.
(a–c) Mean mating frequency of the focal male: (a) Female Experiment; (b) Male Experiment and (c) Female-Male experiment. (d-f) The number of offspring sired by focal males: (a) Female Experiment; (b) Male Experiment and (c) Female-Male experiment. The size of females is represented below the barplot. ♀L—Large females; ♀S—Small females. Solid dark grey–Homogeneous Large, Solid white–Homogeneous Small, Dark grey striped from bottom left to upper right–Heterogeneous Large, White striped from bottom left to upper right–Heterogeneous Small, Light grey striped from bottom right to upper left–Heterogeneous (combined Large and Small).

