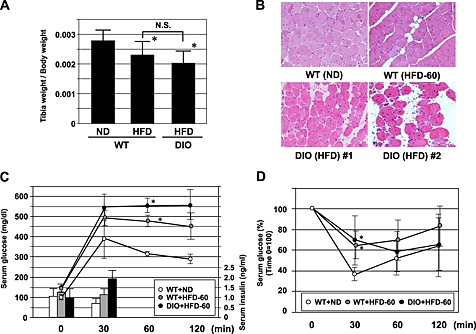
Figure 4.

Comparison of tibialis anterior (TA) muscle weight (A), haematoxylin‐eosin staining of TA muscle at ×100 magnification (B) 2 weeks after cardiotoxin treatment of wild‐type (WT) fed with normal chow (WT + normal diet (ND)) and high‐cholesterol diet (high fat diet (HFD)‐60) (WT + HFD‐60) and diet‐induced obesity (DIO) mice fed HFD‐60. (C) Change of glucose and insulin levels in oral glucose tolerance test. (D) Change of glucose levels in insulin tolerance test. *P < 0.05 versus WT + ND.
