
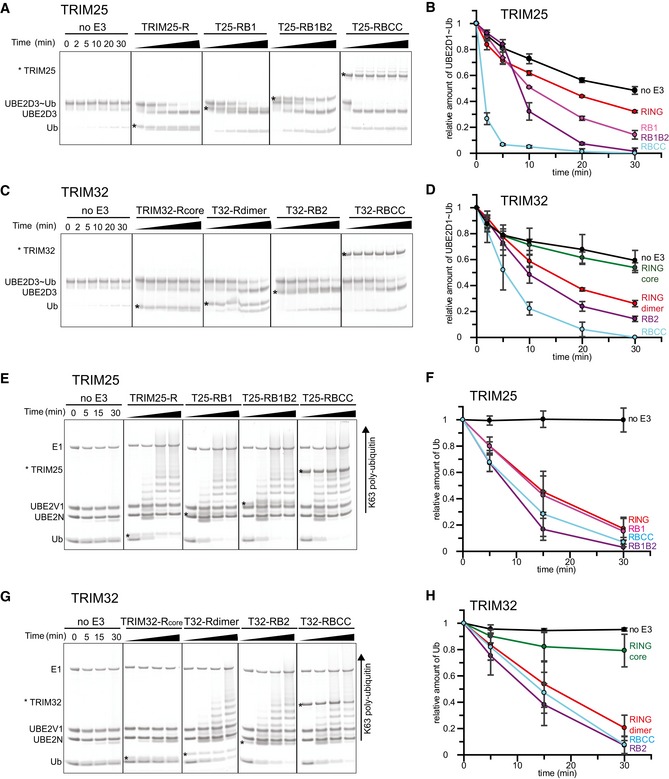
Figure 2. Relationship between oligomeric state and catalytic activity.
-
A–D(A, C) UBE2D3˜Ub discharge assays with different TRIM25 and TRIM32 constructs, respectively. Assays were carried out with TRIM constructs as indicated and the reaction was monitored over 30 min. The asterisk indicates the band for the TRIM construct. (B, D) Quantification of the discharge assays using UBE2D1˜UbAtto and TRIM25 or TRIM32, respectively. The loss of UBE2D1˜UbAtto is plotted as the average of experimental triplicates (± s.d.).
-
E–H(E, G) K63 poly‐ubiquitination assays using UBE2N/UBE2V1 and TRIM25 and TRIM32, respectively. Reactions were incubated for 30 min and samples taken at the indicated times. The asterisk indicates the band for the TRIM construct. (F, H) Assays were quantified (see Materials and Methods) by supplementing the reaction with 1 μM UbAtto and integrating the loss of free UbAtto for TRIM25 and TRIM32, respectively. Assays were carried out in triplicate (± s.d.).
Source data are available online for this figure.