
Figure 4.
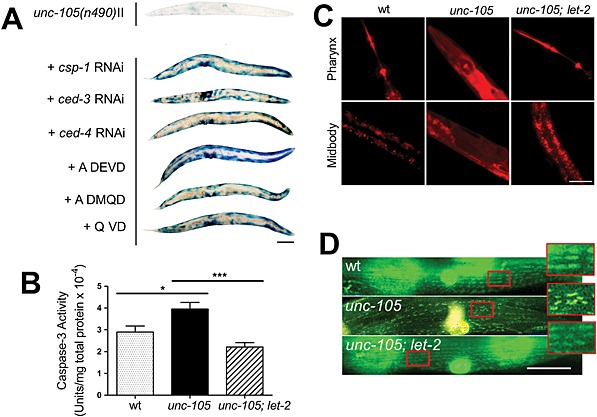
Caspases are activated in muscles of unc‐105 mutants. Synchronized young adults were used (t = 0 h), and all experiments repeated at least three times, for (B) seven independent experiments. (A) Representative stains for β‐galactosidase at t = 72 h post‐adulthood in unc‐105 mutants either untreated or treated with RNAi or drugs targeting caspases; scale bar represents 100 µm. (B) In vitro caspase 3 assay. * denotes P < 0.05 between unc‐105 and wild‐type; *** denotes P < 0.001 between unc‐105 and unc‐105; let‐2; one‐way ANOVA with Newman–Keuls correction. (C) Representative images of a fluorescent caspase 3 indicator substrate, Z‐DEVD‐ProRed™, from t = 24 h adult animals; scale bar represents 50 µm. (D) Representative images of a fluorescent caspase 3 indicator substrate, Z‐DEVD‐ProRed™, from t = 24 h adult animals expressing GFP localized to the mitochondria and nuclei of muscle; scale bar represents 25 µm, and the enlarged regions are an additional 2.5× magnification. Note that the GFP and red substrate combine to produce yellow/orange colour in muscle when viewed using a triple pass filter.