Figure 2.

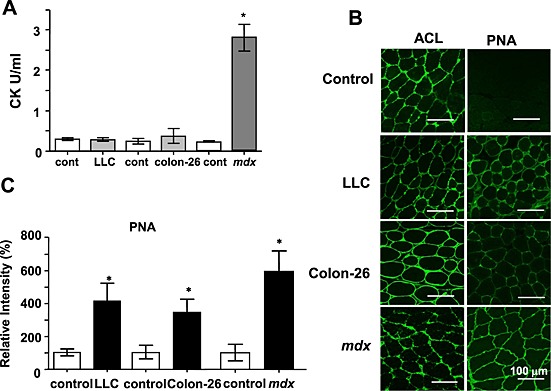
Increased peanut agglutinin (PNA) staining of cancer cachexia muscles. (A) Comparison of serum creatine kinase (CK) levels. Serum CK levels were measured in 8‐ to 12‐week‐old mice. The data represent the mean ± standard error (n = 4). * P < 0.05 compared with control mice. (B) Representative images of muscle frozen sections stained with PNA or Amaranthus caudatus lectin (ACL). Frozen sections of gastrocnemius muscles from phosphate buffered saline (control), Lewis lung carcinoma (LLC) cells (5 × 10⁶ cells), or colon‐26 cells (10 × 106 cells) injected (24 days) mice and mdx mice were stained with biotinylated PNA or ACL followed by fluorescein isothiocyanate‐avidin D. C57BL/6 data were represented as control. Scale bar, 100 µm. (C) Summarized data for PNA staining. Data indicate the mean ± standard error (n = 3–4). *P < 0.05 vs. control. The staining of tumour‐bearing or mdx mice was compared with each control mouse of the same strain.
