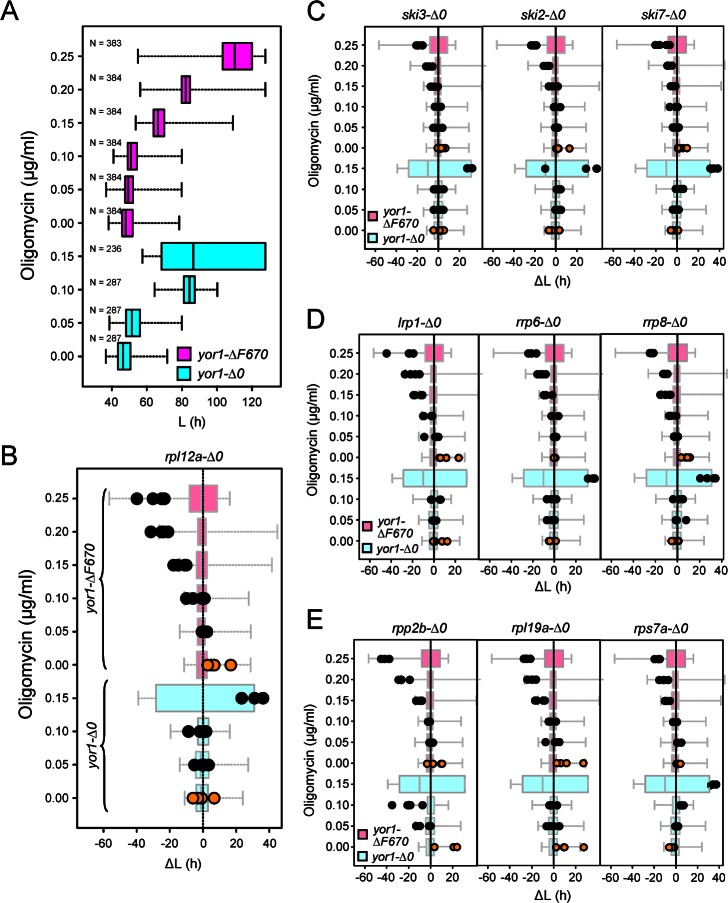
Fig 1. Genes involved in the function of the cytoplasmic exosome, nuclear exosome, rRNA processing and ribosome influence the function of Yor1-ΔF670.
(A) Box-whisker plot of the cell proliferation parameter L (time to reach half-maximal carrying capacity) of the yor1-Δ0 (gene deletion) strain (cyan) and the yor1-ΔF670 mutant (magenta) following treatment with oligomycin at multiple concentrations. 287 cultures were analyzed for yor1-Δ0 and 384 cultures for yor1-ΔF670. “N < 287” or “N < 384” indicates that the concentration of oligomycin was fully growth inhibitory for some of the replicate cultures. Box plots indicate the central 75% of values, whiskers the total value range and averages are indicated by black bars. At higher growth inhibitory concentrations, the phenotypic distributions widen, and thus the high range for the yor1-Δ0 at 0.15 ug/mL oligomycin is not depicted to permit better visualization of the data. The single mutant reference strain data from panel A is dose-normalized and plotted in the background for the identically normalized double-mutant data (black dots) in panels B–E to illustrate how each gene deletion influences the oligomycin resistance associated with the yor1-Δ0 and yor1-ΔF alleles. (B) The RPL12A deletion increases oligomycin resistance in the context of yor1-ΔF670 (magenta), but not yor1-Δ0 (cyan). Oligomycin resistance was compared between the single mutants (shown in panel A) and the respective double mutant cultures, separately constructed in quadruplicate (biological replicates, black circles). Data for each series of replicates was normalized by the difference in L in the absence of oligomcyin (orange circles). (C–E) Plots similar to those in panel B are shown for gene modules comprising the cytoplasmic exosome involved in mRNA regulation (C), genes functioning in the nuclear exosome and rRNA processing (D), and additional ribosomal proteins (E). See Table 1 for additional information. The underlying data of panels A–E can be found in S1 Data.

