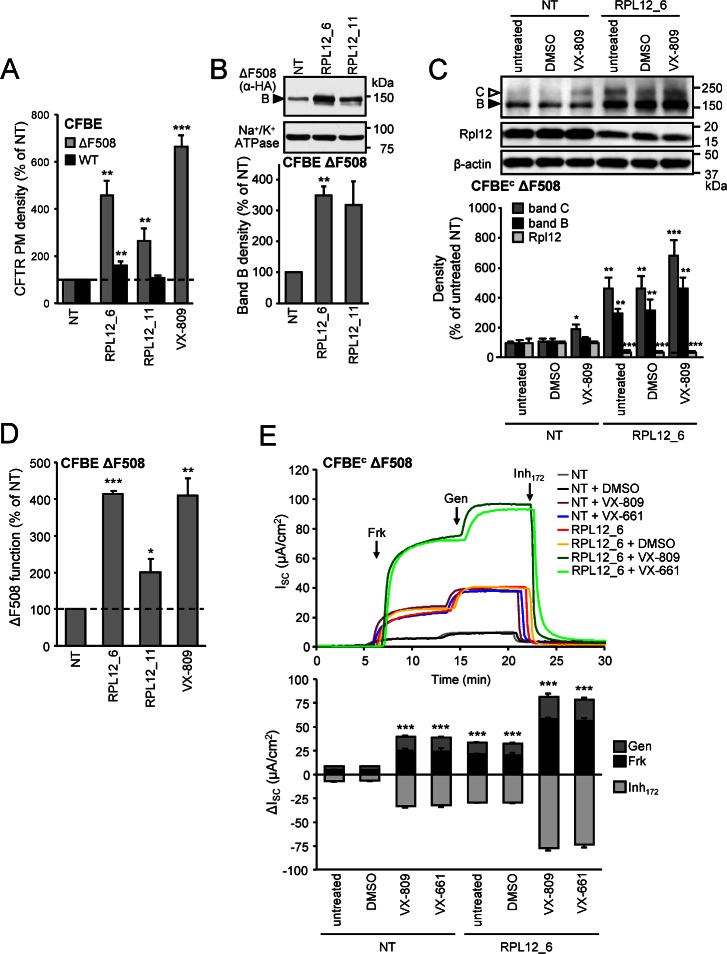
Fig 3. SiRNA-mediated silencing of RPL12 increases ΔF508-CFTR expression, PM density and function at 37°C.
(A) PM density of WT and ΔF508-CFTR upon RPL12 knockdown in CFBE at 37°C (n = 3). (B) Effect of RPL12 knockdown on the expression pattern of ΔF508-CFTR determined by immunoblotting in CFBE (upper panel). CFTR was visualized using anti-HA antibody, anti-Na+/K+-ATPase served as loading control. Densitometric analysis (lower panel, n = 3) of the core-glycosylated (band B, filled arrowhead) ΔF508-CFTR is expressed as percent of controls transfected with NT siRNA (n = 3). (C) The effect of RPL12 knockdown, VX-809 treatment (3 μM, 24 h) or combination of both on the expression pattern of ΔF508-CFTR expressed constitutively in CFBE cells (CFBEc). Immunoblots (upper panel) were probed with antibodies against CFTR (10B6.2), Rpl12, and β-actin as a loading control. Expression levels of Rpl12 and the core- (band B, filled arrowhead) or complex-glycosylated (band C, empty arrowhead) ΔF508-CFTR were quantified by densitometry and are expressed as a percentage compared to controls transfected with NT siRNA (lower panel, n = 3). (D) RPL12 knockdown increases the function of ΔF508-CFTR at physiologic temperature as determined by halide sensitive YFP quenching assay (n = 3). (E) Representative short-circuit current (Isc) recordings (upper panel) and quantification of the changes (ΔIsc, n = 5, lower panel) in CFBEc monolayers expressing ΔF508-CFTR after siRNA-mediated RPL12 knockdown or NT siRNA transfection. CFTR mediated currents were induced by sequential acute addition of Frk (10 μM) and gen (50 μM) followed by CFTR inhibition with inhibitor172 (10 μM) in the presence of a basolateral-to-apical chloride gradient after basolateral permeabilization with amphotericin B (100 μM). The values in D and E were normalized to account for the increase in ΔF508-CFTR mRNA upon siRPL12_6 treatment. *p < 0.05; **p < 0.01; ***p < 0.001. Error bars show SEM of 3–5 independent experiments. The underlying data of panels A–E can be found in S1 Data.

