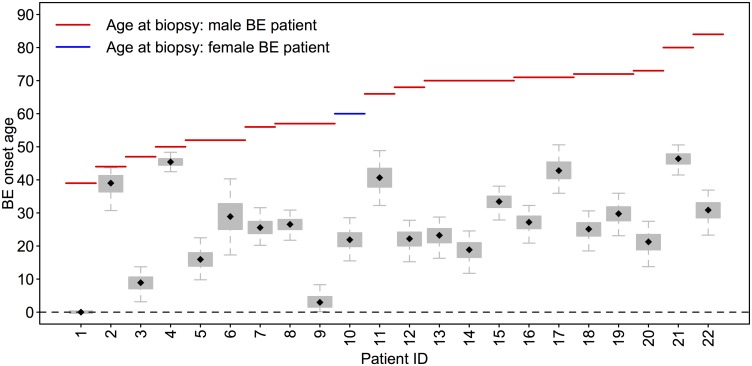
Fig 7. Predicted BE onset times for familial BE patients in D3.
Boxplots depict the MCMC simulated posterior BE onset time distributions for all 22 patients, si, i = 1, …, 22, in data set D3. Testing via the Bayes factor suggests that the difference between average BE dwell times for FBE patients versus average BE dwell times for BE patients in data set D2 (see Fig 6) is highly significant.

