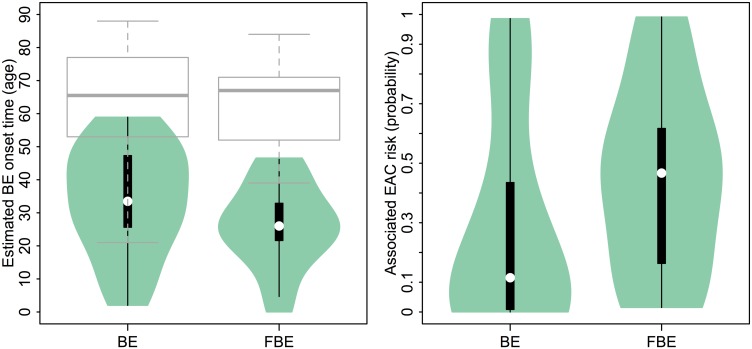
Fig 8. Comparison of Predicted BE onset times and dwell times.
(Left panel) Violin plot depicts distributions of median posterior estimates for BE onset times for N2 = 30 sporadic BE patients in D2 and N3 = 22 familial BE patients in D3, respectively. The boxplots for similar age-at-diagnosis (i.e., age-at-biopsy) for the two groups is also provided (grey boxplots). (Right panel) Violin plot depicts distributions of EAC risk given median BE onset age estimates for general BE patients in D2 and FBE patients in D3, respectively.

