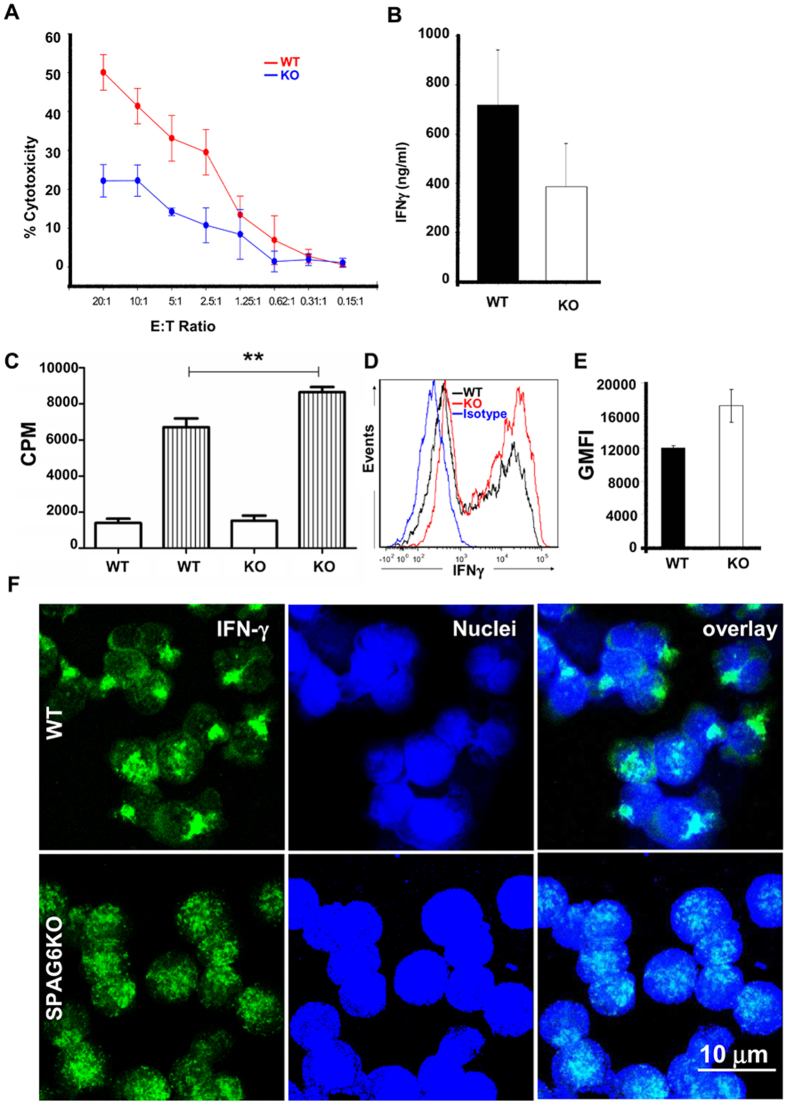
Figure 3. Reduced CTL function in Spag6KO mice.
(A) Allogeneic cytotoxicity assay with decreasing ratios of WT (red) or Spag6KO (blue) CD8+ T cells to P815 target cells; (B) Soluble IFNγ production by activated WT or Spag6KO CD8+ T cells (C) WT or Spag6KO (KO) CD8+ T cell proliferation in media alone (white) or with CD3/CD28 stimulation (stripes). (D) Histogram showing intracellular IFNγ labeling in WT and Spag6KO CD8 T cells compared to isotype control. (E) The geometric mean of intracellular IFNγ fluorescence intensity (GMFI) is significantly higher in the Spag6KO CD8s compared to the WT (F) Intracellular IFNγ distribution in activated WT (upper panel) or Spag6KO (lower panel) CD8+ T cells. N = 3 – 7 per group; **p < 0.005.

