
Figure 1.
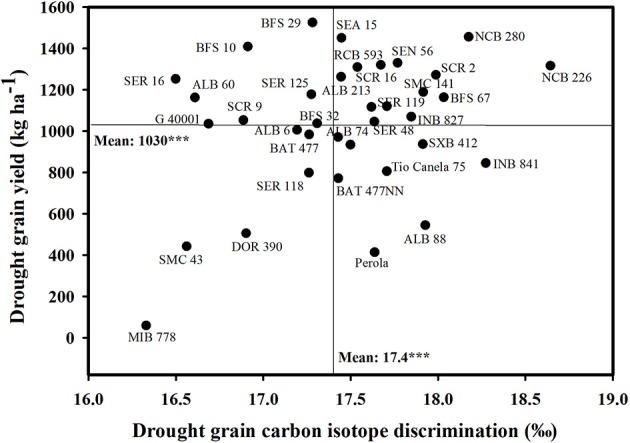
Relationship between grain yield and grain carbon isotope discrimination (CID) under drought stress. Mean values for two seasons (2012, 2013) were used. Water spenders with higher grain yield and greater values of CID were identified in the upper, right hand quadrant. Water savers with higher grain yield and lower values of CID were identified in the upper, left hand quadrant.