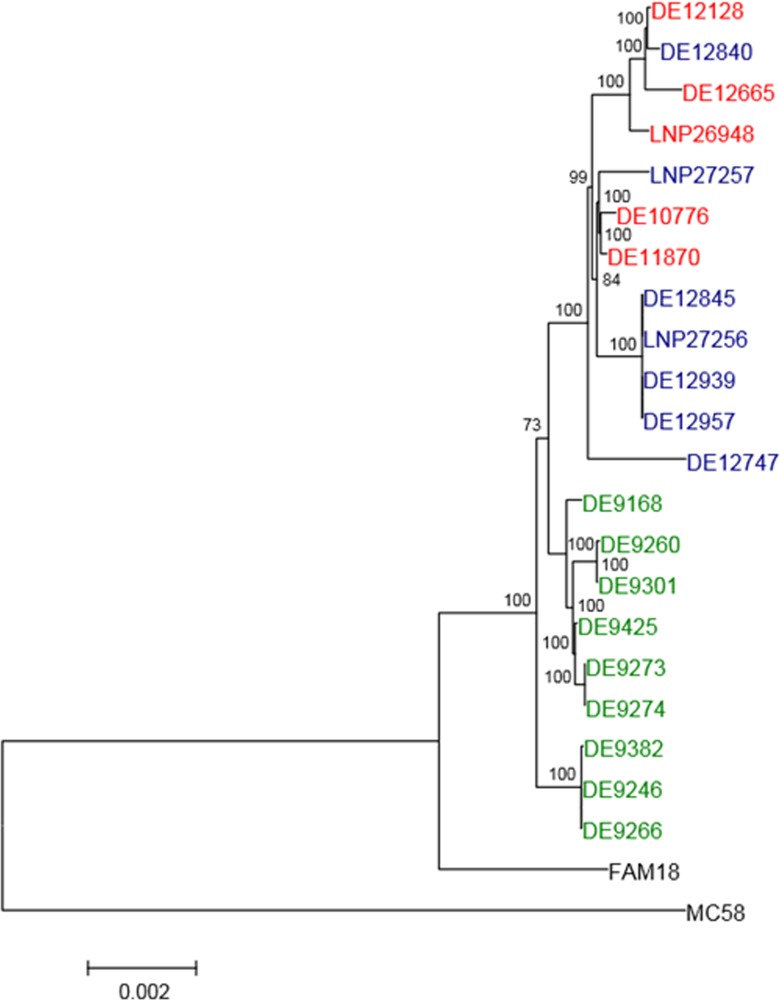
Fig 1. Whole genome sequence based phylogenetic tree.
The neighbor-joining tree was calculated from 1,056 concatenated and multiple aligned core genome genes shared by all studied isolates. Numbers at the branches indicate the percentage of bootstrap support (1,000 replications). Labels in blue represent IMD isolates in MSM; in red urethritis and proctitis isolates; in green adolescent IMD isolates; and in black FAM18 cc11 and MC58 outgroup [42, 43]. A distance scale-bar is shown at the bottom left.

