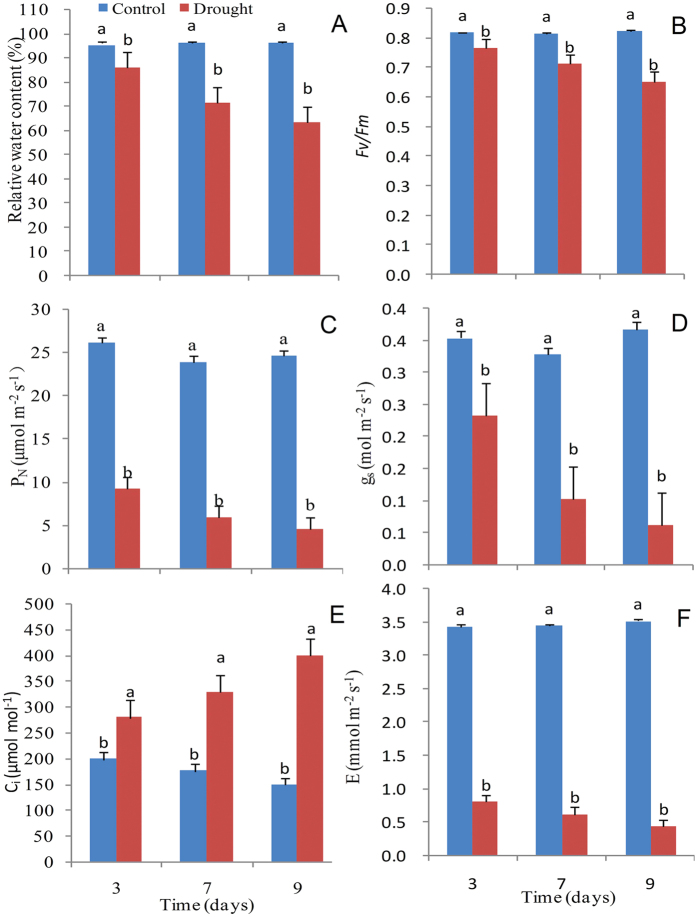
Figure 1. Effects of drought stress on different physiological parameters in leaves of sugarcane.
(A) Leaf relative water content (RWC), (B) Maximum photochemical efficiency (Fv/Fm), (C) Net photosynthetic rate (Pn), (D) Stomatal conductance (gs), (E) Intercellular CO2 concentration (Ci), (F) Transpiration rate. Drought-stressed plants were collected on the 3rd, 7th and 9th days, which corresponded to mild, moderate, and severe water stress conditions, respectively. Bars with different superscript letters indicate significant differences at the P < 0.05 probability at the same time point.

