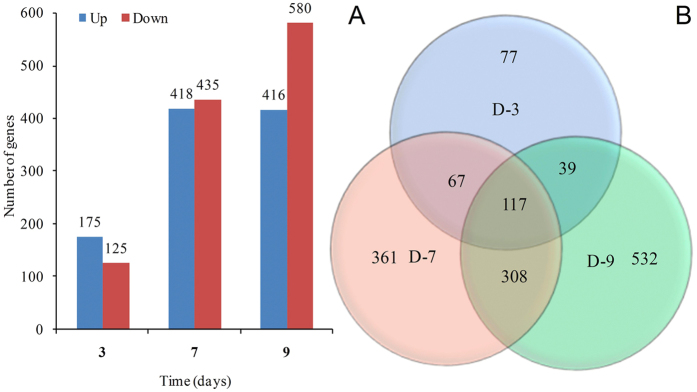
Figure 4. Differential gene expression profiles.
(A) Numbers of induced and repressed genes under mild, moderate, and severe stress conditions. Up and down indicate up- and downregulated genes. (B) Venn diagram presents the number of overlapping genes between the analyzed time points. D-3, D-7 and D-9 represent samples collected on the 3rd, 7th and 9th days, which corresponded to mild, moderate, and severe water stress conditions, respectively.

