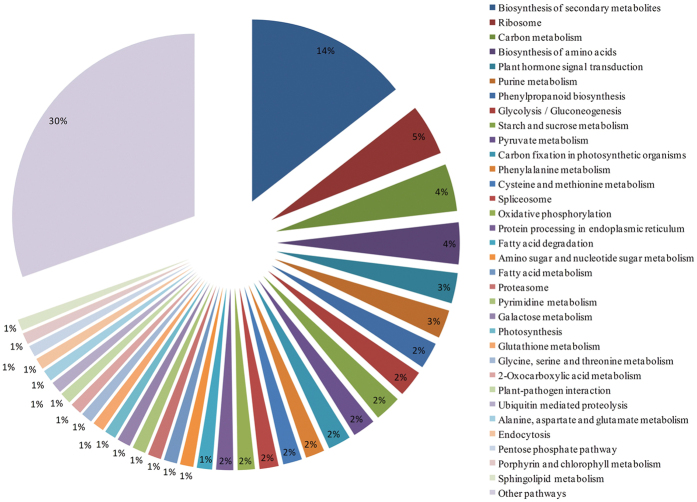
Figure 7. Functional classification of pathway terms for differentially expressed genes under drought stress.
The pathway annotations were acquired with KAAS using an e-value threshold of ≤10−10. A total of 325 differentially expressed genes were classified into 101 pathway categories. The data for pathway categories that represented less than 1% of the differentially expressed genes were included in other pathway categories.

