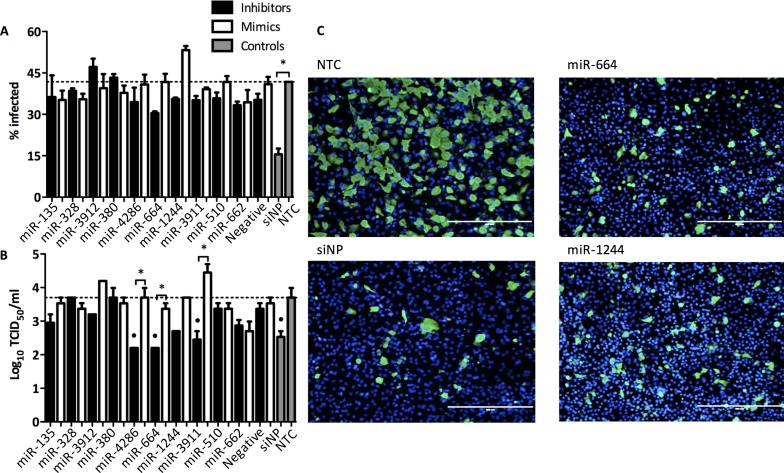
Fig 2. Validation of miRNA inhibitor top hits that reduce H7N9 replication.
(A-B) A549 were transfected with miRNA inhibitors and mimics at 25 nM for 48 h and then infected with H7N9 at MOI 0.01 for 48 h. Cells were fixed with 10% formalin and stained for viral NP and counterstained with DAPI. Stained cells were visualized and analyzed using Cellomics ArrayScan high content imaging system. NTC; Non-transfected control, siNP; Positive control (A) Percentage of infected cells was graphed. The data are from 3 replicate wells +/- SEM. *p<0.05. (B) Supernatants from transfected and infected A549 cells were titrated on MDCK cells. The data are from 3 replicate wells ± SEM. *p<0.05, °p<0.05 compared to positive. (C) Representative fluorescent microscope images were taken with EVOS FL imaging system (Life Technologies). Scale bar, 400 μm. NP, green; DAPI (nuclei), blue.

