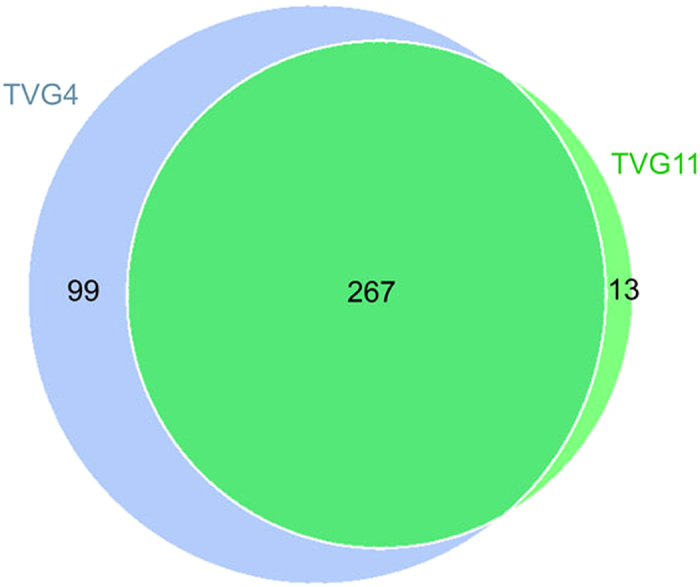
Figure 1. Venn diagrams of the OTUs for bacterial diversity.

Unique and shared OTUs between the two samples were based on 97% similarity. The numbers inside the diagram are the numbers of OTUs.

Unique and shared OTUs between the two samples were based on 97% similarity. The numbers inside the diagram are the numbers of OTUs.